Group Abstract Group Abstract

Message Boards Message Boards

0
|
3.4K Views
|
14 Replies
|
0 Total Likes
View groups...
Share
Share this post:

Null will change widths of figures in GraphicsGrid

Posted 3 years ago

Hello, I find Null will change widths of figures in GraphicsGrid. For example:

a = Table[Plot[Sin[x], {x, 0, b}], {b, 5}];b = GraphicsGrid[Partition[Prepend[a, Null], 3], ImageSize -> Full]
GraphicsGrid[Partition[a, 3], ImageSize -> Full]

enter image description here

So, how to make their widths same?

POSTED BY: Zhenyu Zeng
14 Replies
Posted 3 years ago

Thanks a lot. You're right, I will just pick the one with fewer defects.

POSTED BY: Zhenyu Zeng
Posted 3 years ago

Pick your poison. (That's an English idiom that means none of the choices are ideal. It's a dilemma. You'll have to choose the least bad option.)

POSTED BY: Eric Rimbey
Posted 3 years ago

Grid can't align axes and can't make each plot's size to default, so sometimes the plots are too small in Grid.

POSTED BY: Zhenyu Zeng
Posted 3 years ago

I don't know the reason. What your latest examples show, however, is more "global" variation across the entire grid. The Null isn't causing unusual padding. The presence of the Null is causing the GraphicsGrid to calculate it's dimensions differently, but once it's done that, the result is "regular".

As Rohit said, it seems to be harder to control the output with GraphicsGrid than with Grid. I haven't used GraphicsGrid much, so I don't have any suggestions for how to get what you want. You'll have to play around with the options (e.g. Alignment). Or just use Grid.

However, if you're wanting each "cell" in the graphics grid to have the same dimensions, then you're never going to regularize the padding if your plots have different dimensions. Space will have to be added somewhere. So, maybe you can play with the Plot options for each little plot so that they are all the same dimensions and no variations in padding will occur.

POSTED BY: Eric Rimbey
Posted 3 years ago

With 'Null' and without 'Null' have too much difference:

plots = Table[
   Plot[k Sin[x], {x, 0, 2 Pi}, AspectRatio -> 1/1, 
    Background -> LightBlue], {k, 1, 6}];
GraphicsGrid[Partition[plots, 3], Dividers -> All]
GraphicsGrid[Partition[ReplacePart[plots, Null, 3], 3], 
 Dividers -> All]

enter image description here

POSTED BY: Zhenyu Zeng
Posted 3 years ago

Thanks for your patience. Every time you replied to me with a lot of words, but I didn't. It is not that I don't want to state clearly, but my English is really poor. I hope this would not make you not feel good. I read your answer several times and then I really know all that you said. I feel that you are right as your reply can really explain the phenomena above.

However, I test a case which can't be explained by your explanation. Let's check it:

b = Table[Plot[Sin[x], {x, 0, 3}, Frame -> True], {b, 5}];
GraphicsGrid[Partition[Insert[b, Null, 1], 3], ImageSize -> Full]

enter image description here

GraphicsGrid[Partition[b, UpTo[3]], ImageSize -> Full]

enter image description here

The difference between these two figures can't be explained by your answers. May you take time to find the reason for this case?

Have a nice day.

POSTED BY: Zhenyu Zeng
Posted 3 years ago

Here, this should illustrate what I'm saying:

plots = 
  Table[
    Plot[
      k Sin[x], {x, 0, 2 Pi}, AspectRatio -> Automatic, Background -> LightBlue], 
      {k, 1, 6}];
GraphicsGrid[Partition[plots, 3], Dividers -> All]

enter image description here

POSTED BY: Eric Rimbey
Posted 3 years ago

Okay. Your hypothesis is that in a GraphicsGrid, the presence of a Null in one "cell" of the grid causes extra spacing to occur in an adjacent "cell". Let's test that:

b = Table[Plot[Sin[x], {x, 0, 3}], {b, 5}];

Now, let's try all six possible positions for Null:

GraphicsGrid[Partition[Insert[b, Null, 1], 3], ImageSize -> Full]

enter image description here

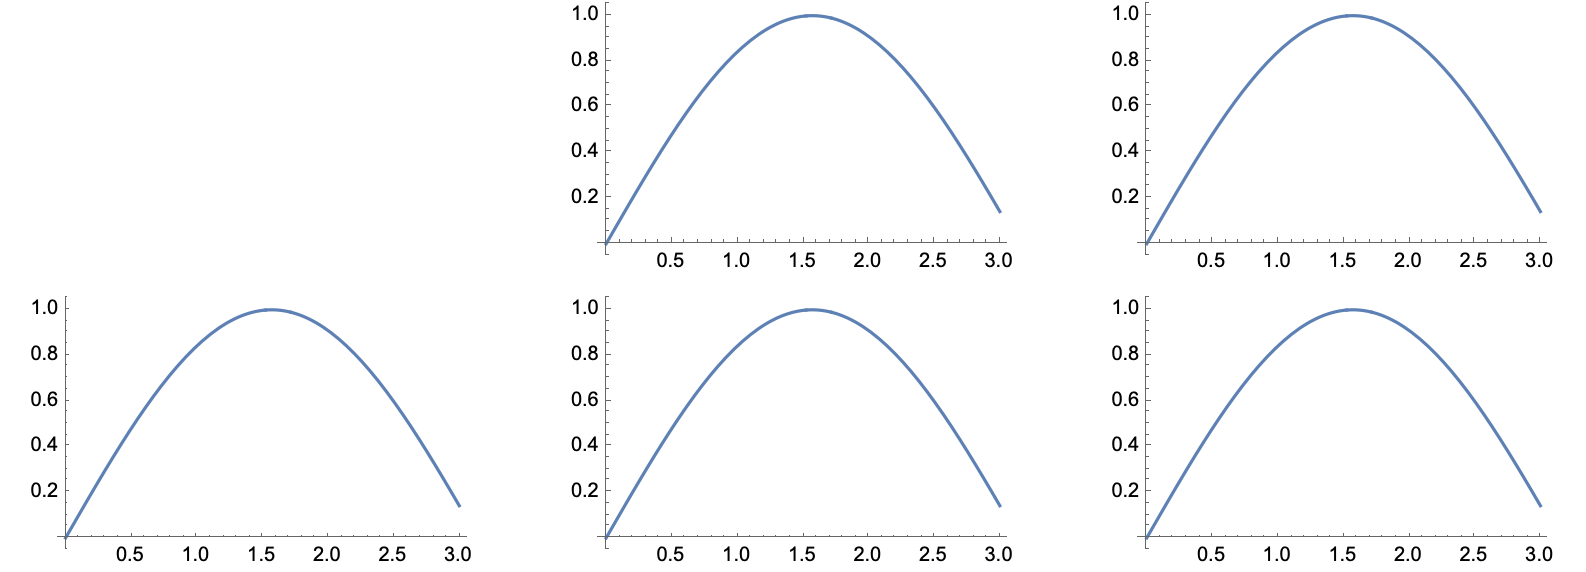
GraphicsGrid[Partition[Insert[b, Null, 2], 3], ImageSize -> Full]

enter image description here

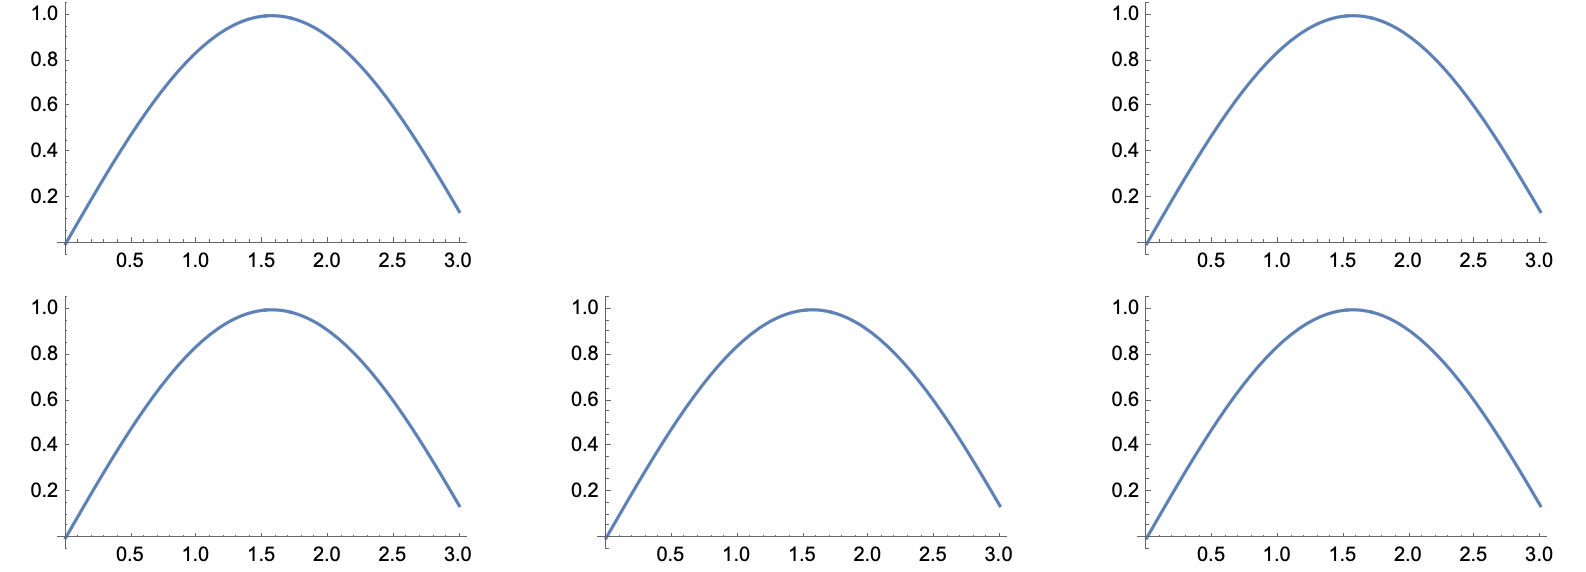
GraphicsGrid[Partition[Insert[b, Null, 3], 3], ImageSize -> Full]

enter image description here

GraphicsGrid[Partition[Insert[b, Null, 4], 3], ImageSize -> Full]

enter image description here

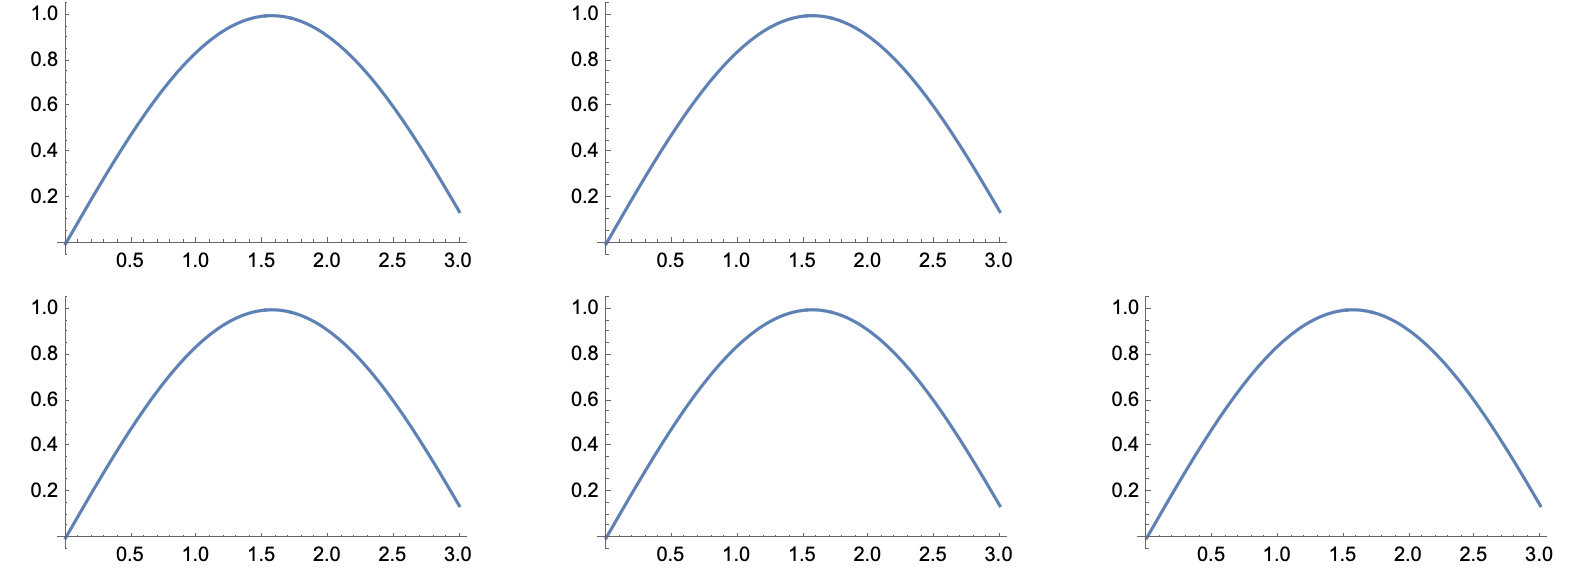
GraphicsGrid[Partition[Insert[b, Null, 5], 3], ImageSize -> Full]

enter image description here

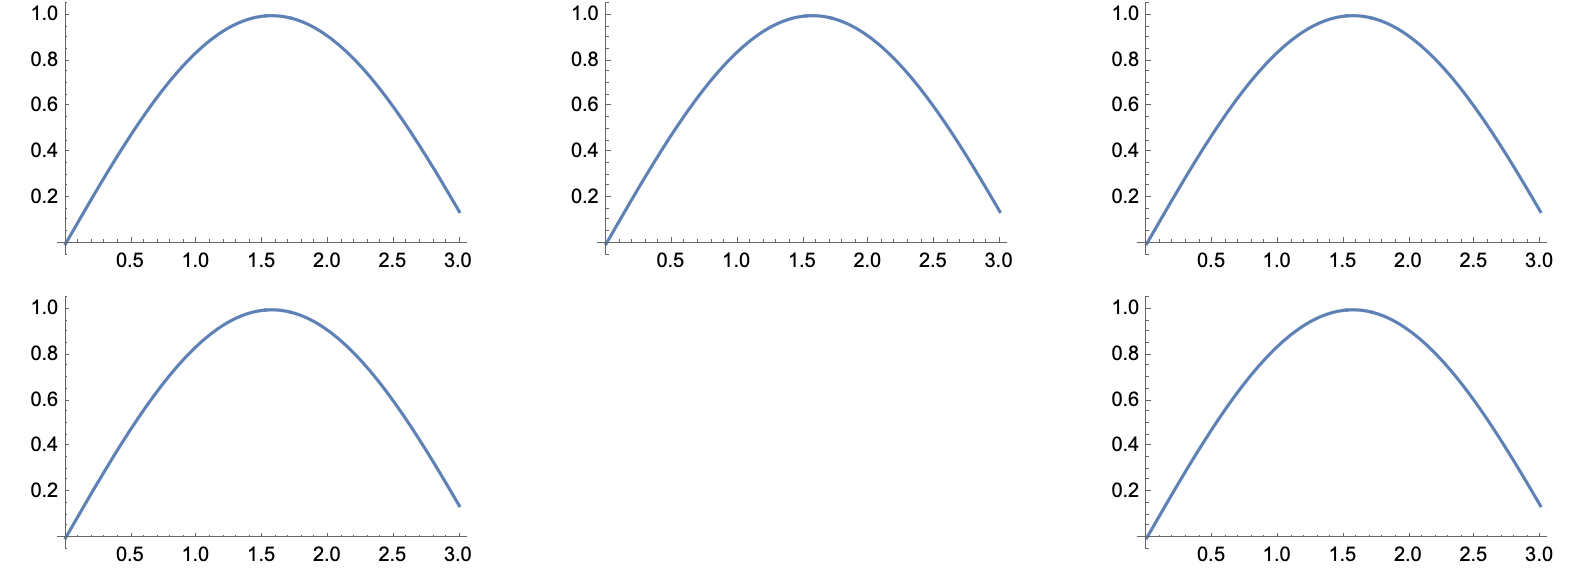
GraphicsGrid[Partition[Insert[b, Null, 6], 3], ImageSize -> Full]

enter image description here

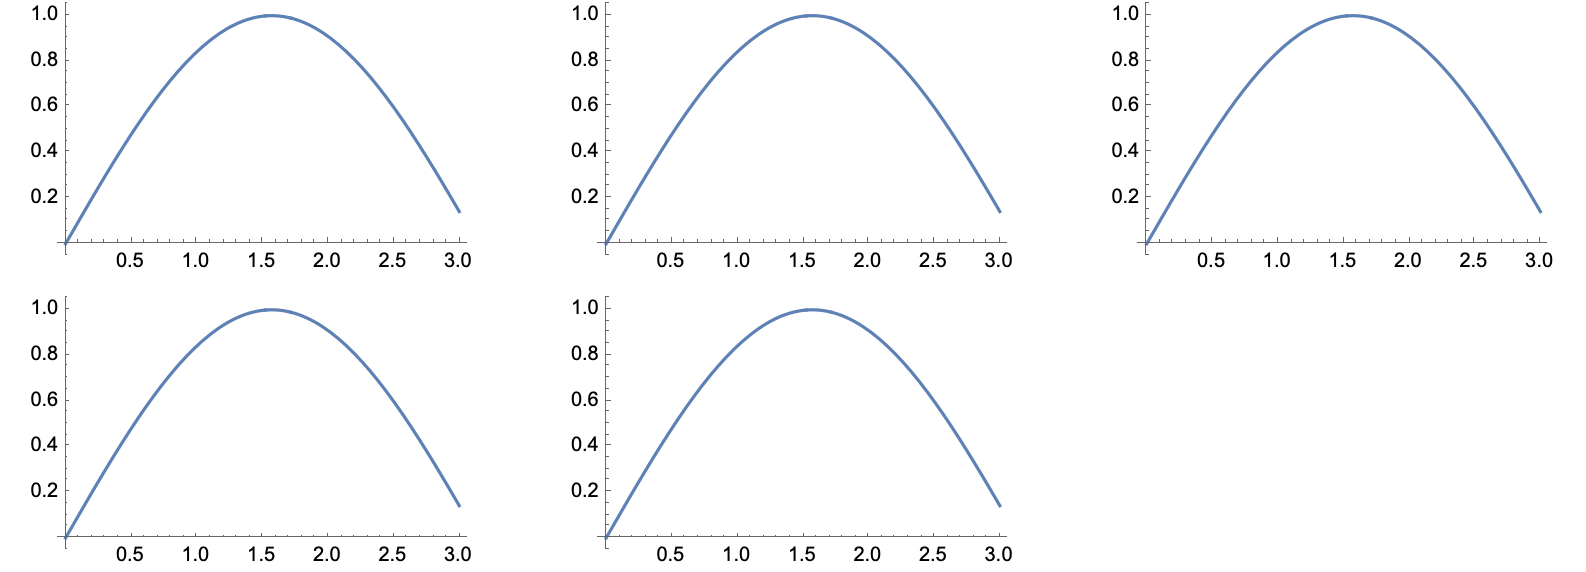
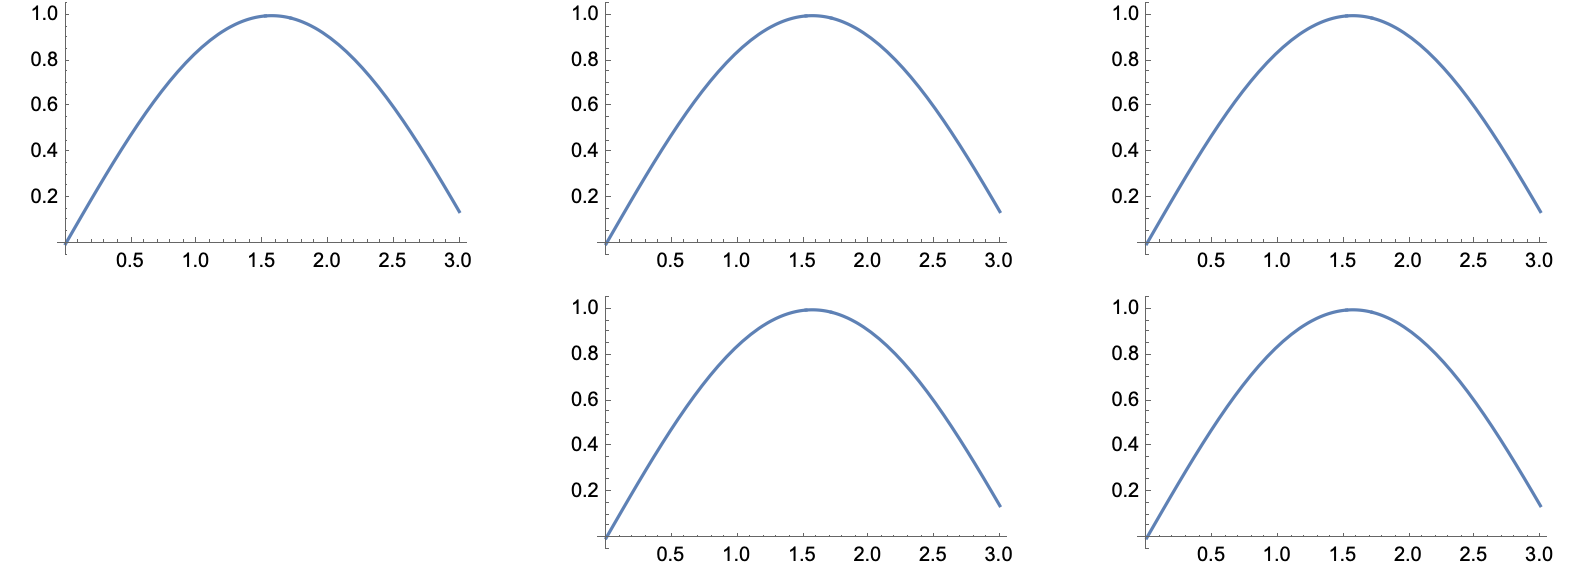
Your eyes are probably better than mine. Please point out to me which one of these images shows that extra space was added. If the spacing in these images was not affected by Null, then what could have affected the spacing in your original example? It seems like a reasonable conclusion to me that it has something to do with scaling different images to fit the grid.

Furthermore, your examples actually support MY hypothesis. In your latest example, you show one grid where padding seemed to be added and one where it was not. In the grid with extra padding, it was placed in a row where one image had tick marks at the bottom and the rest did not. In the grid with no extra padding, every element in each row of the grid was the same in this regard. Furthermore, in the second grid, PADDING WAS ADDED EXACTLY AS I PREDICTED. The padding between ROWS is now larger. You don't seem to care about that spacing, but it is there. The horizontal padding is due to one of the plots having a thinner aspect ratio. The vertical padding is due to 5 of them having wider aspect ratio.

POSTED BY: Eric Rimbey
Posted 3 years ago

Null changes the space around the figure:

a = Table[Plot[Sin[x], {x, 0, b}], {b, 5}];

b = GraphicsGrid[Partition[Prepend[a, Null], 3], ImageSize -> Full]

enter image description here

c=GraphicsGrid[Partition[a, UpTo[3]], ImageSize -> Full]

enter image description here

POSTED BY: Zhenyu Zeng
Posted 3 years ago

But Grid can not align axes and When the images are large, the grid will make the images too small.

POSTED BY: Zhenyu Zeng
Posted 3 years ago

I have always had issues with the sizes of items using GraphicsGrid and prefer to use Grid instead.

a = Table[Plot[Sin[x], {x, 0, b}], {b, 5}];
Grid[Partition[Prepend[a, Null], UpTo@3], Frame -> All]
Grid[Partition[a, UpTo@3], Frame -> All]
POSTED BY: Rohit Namjoshi
Posted 3 years ago

I don't think the Null is causing any extra space. I think what is happening here is that the plot at position 3 of list a has a different overall aspect ratio that those at position 4 & 5. It's different because plot 3 needs extra room for the tick labels at the bottom. Plots 4 & 5 have their tick labels in the middle, and so don't need extra space at the bottom. The GraphicsGrid is trying to make every cell the same size, so plots 1-3 force the vertical size to expand a bit, and plots 4-5 force the horizontal size to expand a bit. Juxtaposing plot 3 next to plots 4-5 makes the resulting padding more obvious.

It might be easier to see/understand if you add dividers and play with alignment:

GraphicsGrid[Partition[Prepend[a, Null], 3], ImageSize -> Full, 
 Alignment -> {Right, Top}, Dividers -> All]

and

GraphicsGrid[Partition[Prepend[a, Null], 3], ImageSize -> Full, 
 Alignment -> {Left, Bottom}, Dividers -> All]
POSTED BY: Eric Rimbey
Posted 3 years ago

Because when forming a graph, I want the upper left corner to be empty instead of the lower right corner. Wherever to be empty with Partition, it does not has the same gaps between figures as no Null.

POSTED BY: Zhenyu Zeng
Posted 3 years ago

What is the reason for prepending Null?

Also, with Partition you should use UpTo so all elements are present.

 Partition[Range@5, 3]
(* {{1, 2, 3}} *)

Partition[Range@5, UpTo@3]
(* {{1, 2, 3}, {4, 5}} *)
POSTED BY: Rohit Namjoshi
Reply to this discussion
Community posts can be styled and formatted using the Markdown syntax.
Reply Preview
Attachments
Remove
or Discard