I've been messing around with the CreateDataStructure function and generating binary trees. However, the tree gets enormous, and the built-in parameter "visualization" creates an image or graphic that needs to be resized to visualize the tree correctly. I attempted to use the ImageResize function to do this but was thrown an error.
CreateDataSructure - creates a data structure with the specified type. https://reference.wolfram.com/language/ref/CreateDataStructure.html
The specified type is BinaryTree https://reference.wolfram.com/language/ref/datastructure/BinaryTree.html
You can then interact with this variable and do other calls on it. For instance, "Visualization" generates a 'visualization'. Except this call doesn't output anything that can be manipulated with ImageResize. An error that it's not an image or graphic pops up. The binary tree I am generating is too large for this, and I would like to adjust the image size so that it can fit on an 8.5" x 11" printout.
Here is the function. https://reference.wolfram.com/language/ref/ImageResize.html
binaryTree2 = CreateDataStructure["BinaryTree", "0"];
binaryTree2 = growTree[gameTree2];
binaryTree2["Visualization"]
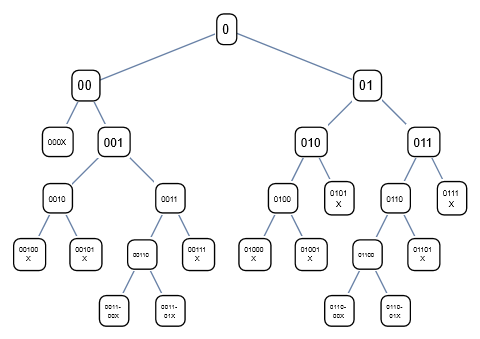
This is the output from the visualization call onto binarytree2. I get an error when using the same call in ImageResize.
In[25]:= ImageResize[gameTree2["Visualization"],100]

During evaluation of In[25]:= ImageResize::imginv: Expecting an image or graphics instead of .
Out[25]= ImageResize[,100]
Here is what the output actually looks like. 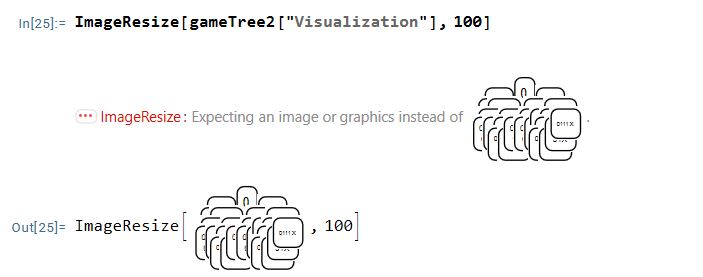
I have also attempted to right click the image and convert it to graphics and get the following error.
Set::write: Tag Inherited in Inherited[State] is Protected.


