Hi Bruno,
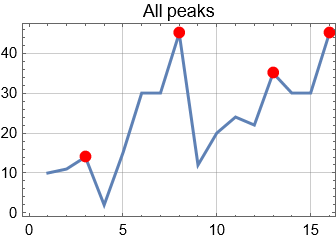
Here is an example with fake data:
There will certainly be other possibilities, but maybe this will help?
fakedata = {10, 11, 14, 2, 15, 30, 30, 45, 12, 20, 24, 22, 35, 30, 30,
45};
findpeaks = FindPeaks[fakedata]
p1 = ListLinePlot[fakedata, ImageSize -> Small, Frame -> True,
GridLines -> Automatic];
p2 = ListPlot[
Tooltip[findpeaks,
TooltipStyle -> {12, Bold, Red, Background -> LightGreen}]
, Frame -> True
, GridLines -> Automatic
, ImageSize -> Small
, PlotMarkers -> Style["[Bullet]", FontSize -> 25, Red]
];
Show[p1, p2, Frame -> True, PlotLabel -> "All peaks",
LabelStyle -> Directive[Black, 8]];

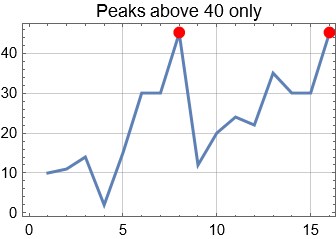
Now we select and plot peaks above 40:
select40Above = Select[findpeaks, Last[#] > 40 &];
p3 = ListPlot[
Tooltip[select40Above,
TooltipStyle -> {12, Bold, Red, Background -> LightGreen}]
, Frame -> True
, GridLines -> Automatic
, ImageSize -> Small
, PlotMarkers -> Style["[Bullet]", FontSize -> 25, Red]
];
Show[p1, p3, Frame -> True, PlotLabel -> "Peaks above 40 only",
LabelStyle -> Directive[Black, 8]]

Best Regards,.....Jos