Daniel,
First, to get your bar legend, you need to make a change in syntax:
Plot3D[Re[fun^2 + 1], {x, -2, 2}, {y, -2, 2},
 ColorFunction -> Function[{x, y, z}, Hue[Im[(x + y I)^2 + 1]]],
 PlotLegends -> BarLegend[{Hue, {-4, 4}}]]
As to the Color function, the problem is the default behavior is ColorFunctionScaling->True which scales your x,y, and z to the range 0 to 1. This means that your calculation of Im[fun^2+1] is no longer correct. You need to use ColorFunctionScaling->False, and then you need to scale the values of the argument to Hue to make sense (between 0 and 1). This means you need an offset and scale to Hue to get your function values between 0 and 1. You can automate this easily but the basic plot should look something like this:
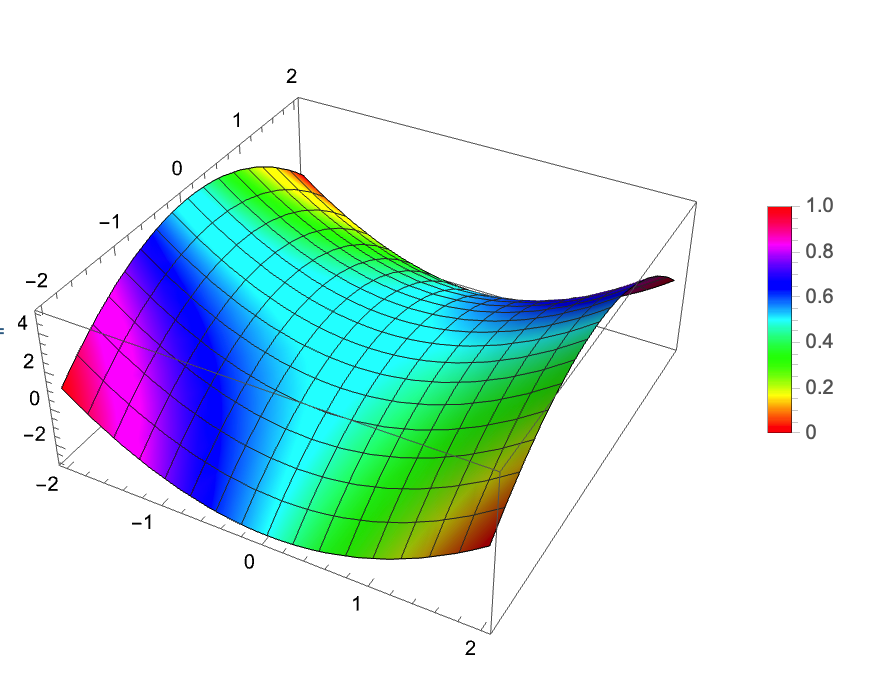
Plot3D[Re[fun^2 + 1], {x, -2, 2}, {y, -2, 2},
 ColorFunction ->
  Function[{x, y, z}, Hue[(Im[(x + y*I)^2 + 1] + 8)/16]],
 ColorFunctionScaling -> False, PlotLegends -> BarLegend[Hue]]
The legend has the wrong values but you can fix that by creating a function to give to BarLegend that scales the values so the bar is correct.
You get the following:
Regards,
Neil


