Message Boards Message Boards

0
|
2455 Views
|
8 Replies
|
1 Total Likes
View groups...
Share
Share this post:

Plotting 3D complex numbers with colors encoding the imaginary part

Posted 1 year ago

Mathematica can plot the complex function using abs and arg, but I want to plot a complex function with colors encoding the imaginary part. I cannot figure it out. Thanks in advance!

POSTED BY: Daniel Niu
8 Replies

Daniel,

Sorry I missed your request.

I want to know why you use Im[(x + yI)^2 + 1] + 8)/16 to scale the value to [0,1]? why not use Im[(x + yI)^2 + 1] /8 directly?

The Hue function ranges from 0 to 1 but your data ranges from -8 to 8 so you need to both scale and offset the function to get a full range of hues in the plot. Dividing by 8 gives you a range of -1 to 1. Dividing by 16 gives you a range of -0.5 to 0.5 and we shift it by 0.5 (8/16) to go from 0 to 1.

By the way, could you please provide the code for scaling the bar?

Plot3D[Re[fun^2 + 1], {x, -2, 2}, {y, -2, 2}, 
 ColorFunction -> Function[{x, y, z}, myHue[Im[(x + y*I)^2 + 1]]], 
 ColorFunctionScaling -> False, 
 PlotLegends -> BarLegend[{myHue[#] &, {-8, 8}}]]

Regards,

Neil

POSTED BY: Neil Singer

Glad to help, I'm also glad you caught my error in the first post -- I did not consider the scaling problem (although I have been burned by that multiple times in the past!) Whenever I used a custom color function I frequently had to alter the ColorFunctionScaling to get proper results.

Regards,

Neil

POSTED BY: Neil Singer

Daniel,

First, to get your bar legend, you need to make a change in syntax:

Plot3D[Re[fun^2 + 1], {x, -2, 2}, {y, -2, 2}, 
 ColorFunction -> Function[{x, y, z}, Hue[Im[(x + y I)^2 + 1]]], 
 PlotLegends -> BarLegend[{Hue, {-4, 4}}]]

As to the Color function, the problem is the default behavior is ColorFunctionScaling->True which scales your x,y, and z to the range 0 to 1. This means that your calculation of Im[fun^2+1] is no longer correct. You need to use ColorFunctionScaling->False, and then you need to scale the values of the argument to Hue to make sense (between 0 and 1). This means you need an offset and scale to Hue to get your function values between 0 and 1. You can automate this easily but the basic plot should look something like this:

Plot3D[Re[fun^2 + 1], {x, -2, 2}, {y, -2, 2}, 
 ColorFunction -> 
  Function[{x, y, z}, Hue[(Im[(x + y*I)^2 + 1] + 8)/16]], 
 ColorFunctionScaling -> False, PlotLegends -> BarLegend[Hue]]

The legend has the wrong values but you can fix that by creating a function to give to BarLegend that scales the values so the bar is correct.

You get the following:
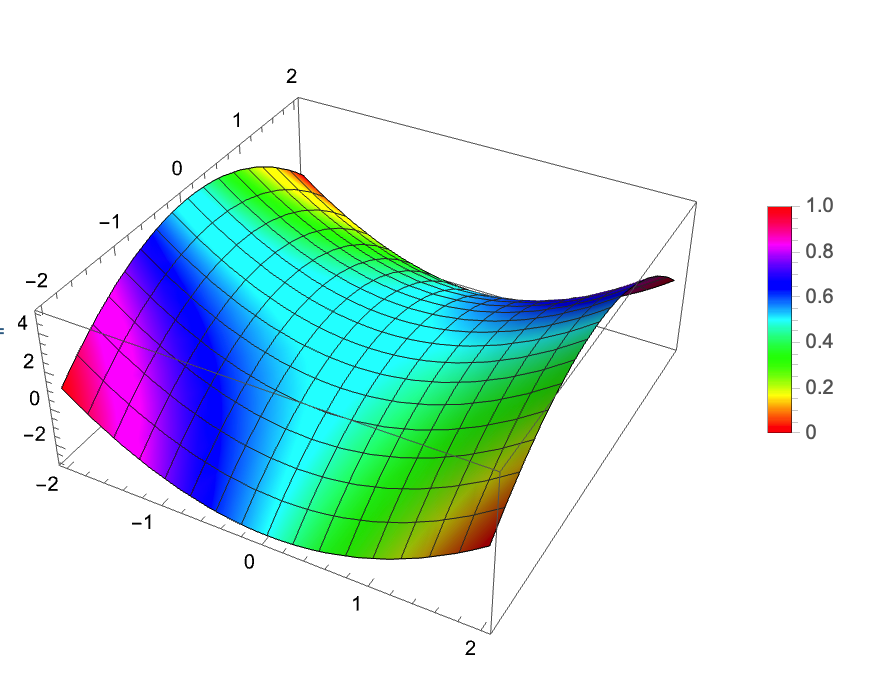
enter image description here

Regards,

Neil

POSTED BY: Neil Singer
Posted 1 year ago

Thank you, Neil. I didn't expect it to be so complicated to use Mathematica to visualize the complex function encoding the imaginary part. Thank you.

POSTED BY: Daniel Niu
Posted 1 year ago

Dear Neil, I want to know why you use Im[(x + y*I)^2 + 1] + 8)/16 to scale the value to [0,1]? why not use Im[(x + y*I)^2 + 1] /8 directly? thank you!

POSTED BY: Daniel Niu
Posted 1 year ago

By the way, could you please provide the code for scaling the bar? I have a tried, but failed. Thank you!

POSTED BY: Daniel Niu

Daniel,

The problem is syntax:

You entered

ColorFunction -> Function[{x, y, z}, Hue[Im[z^2 + 1]]]

In this function, the x is the real part of z, the y is the Imaginary part of z, BUT z is not your original z its the magnitude of Re[z^2 + 1]. Using z in two places like that is confusing and leads to errors.

You can fix it with:

fun = x + y I;
Plot3D[Re[fun^2 + 1], {x, -2, 2}, {y, -2, 2}, 
 ColorFunction -> Function[{x, y, z}, Hue[Im[fun^2 + 1]]], 
 PlotLegends -> BarLegend[Hue[-4, 4]]]

to get

enter image description here

Regards,

Neil

POSTED BY: Neil Singer
Posted 1 year ago

Dear Neil, Thank you for your explanation. I correct the code, however, I don't think I get what I want. Mathematica seems not to encode the color with imaginary parts, because I do the same thing using MATLAB which is what I want. The two figure is totally different. enter image description here

POSTED BY: Daniel Niu
Reply to this discussion
Community posts can be styled and formatted using the Markdown syntax.
Reply Preview
Attachments
Remove
or Discard

Group Abstract Group Abstract