Hi Rachel,
What is the definition of RateOfChange? It is not a built-in WL function. It is a FinancialIndicator, and those can be applied to a TimeSeries. E.g.
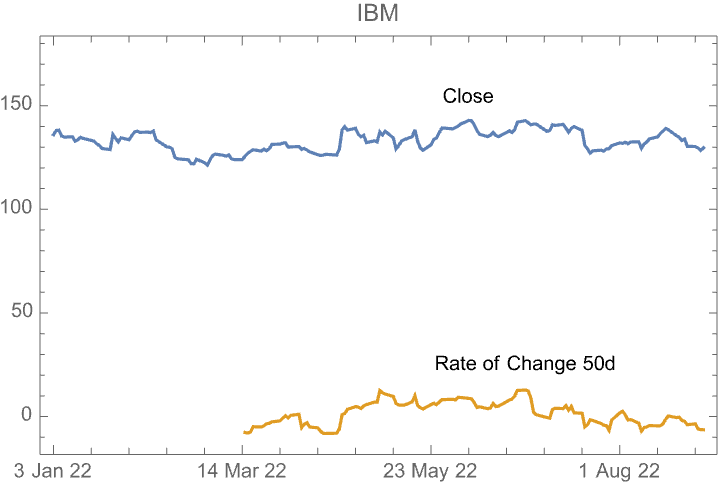
data = FinancialData["IBM", "Close", {{2022, 1, 1}, {2022, 9, 1}}]
rateOfChange50 = FinancialIndicator["RateOfChange", 50]@data
You can apply any FinancialIndicator to a TimeSeries as long as it has the required data. E.g. to apply "PriceVolumeTrend" the TimeSeries must have the values for Close and Volume.
To get the values from these TimeSeries
data // Normal
rateOfChange50 // Normal
To plot them
DateListPlot[{data, rateOfChange50},
 PlotLabel -> "IBM",
 DateTicksFormat -> {"DayShort", " ", "MonthNameShort", " ", "YearShort"},
 PlotLabels -> Placed[{"Close", "Rate of Change 50d"}, Above]]
There is no easy way to extract these values from TradingChart


