Message Boards Message Boards

0
|
3405 Views
|
8 Replies
|
8 Total Likes
View groups...
Share
Share this post:

List of 50-day simple moving average for stock

Posted 2 years ago

I'm trying to obtain a list showing date and value (daily) of 50-day simple moving average for IBM stock, specified date range January 1 2022 to September 1 2022. I'd like to see a list of values vs. a chart. Would appreciate it if someone could show me how to enter on Wolfram, I'm not having any luck with Wolfram accepting the syntax I've entered.

POSTED BY: Rachel Brown
8 Replies
Posted 2 years ago

Hi Rachel,

Is this what you are looking for?

data = FinancialData["IBM", {{2022, 1, 1}, {2022, 9, 1}}, "Close"]
movingAverage50 = MovingAverage[data, 50]
DateListPlot[movingAverage50]

Date/value list for the moving average

movingAverage50 // Normal
POSTED BY: Rohit Namjoshi
Posted 2 years ago

Hi Rachel,

the // Normal instruction in any of my searches on how to create a list from a chart

Normal is not creating a list from a chart. FinancialData returns a TimeSeries which is shown in the frontend in graphical form. Normal, when applied to a TimeSeries, returns the list of date/value pairs. In general Normal can be used to look at the underlying data for objects that are represented in graphical/icon form by the frontend. E.g. sa = SparseArray[{{1, 1} -> 1, {2, 2} -> 2, {3, 3} -> 3, {1, 3} -> 4}] Normal@sa

sales = Import["ExampleData/RetailSales.tsv", "Dataset"]
Normal@sales

You can also use TradingChart with a "SimpleMovingAverage" FinancialIndicator. E.g.

TradingChart[{"IBM", {{2022, 1, 1}, {2022, 9, 1}}}, 
 {"BollingerBands",FinancialIndicator["SimpleMovingAverage", 50]}]

The chart is dynamic, hover over it.

If you are new to the Wolfram Language, take a look at the free online interactive book by Stephen Wolfram.

POSTED BY: Rohit Namjoshi
Posted 2 years ago

Hi Rachel,

What is the definition of RateOfChange? It is not a built-in WL function. It is a FinancialIndicator, and those can be applied to a TimeSeries. E.g.

data = FinancialData["IBM", "Close", {{2022, 1, 1}, {2022, 9, 1}}]
rateOfChange50 = FinancialIndicator["RateOfChange", 50]@data

You can apply any FinancialIndicator to a TimeSeries as long as it has the required data. E.g. to apply "PriceVolumeTrend" the TimeSeries must have the values for Close and Volume.

To get the values from these TimeSeries

data // Normal
rateOfChange50 // Normal

To plot them

DateListPlot[{data, rateOfChange50},
 PlotLabel -> "IBM",
 DateTicksFormat -> {"DayShort", " ", "MonthNameShort", " ", "YearShort"},
 PlotLabels -> Placed[{"Close", "Rate of Change 50d"}, Above]]
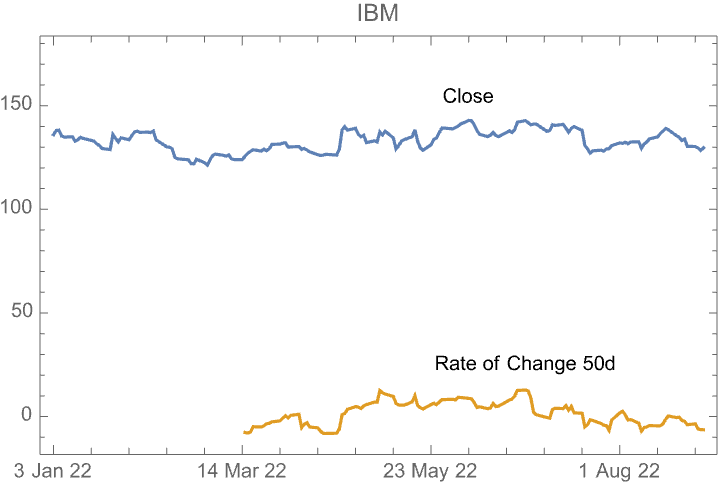
enter image description here

There is no easy way to extract these values from TradingChart

POSTED BY: Rohit Namjoshi
Posted 2 years ago

Hi Rohit,

Yes, this is what I'm looking for. Thank you so much. I'm a complete beginner, so familiarizing myself with Wolfram language. You've been a huge help. I didn't see the // Normal instruction in any of my searches on how to create a list from a chart.

Regards, Rachel

POSTED BY: Rachel Brown
Posted 2 years ago

Hi Rohit,

Thanks for the further explanation. I'm not familiar with the terminology - I meant that I didn't find // Normal in any of my searches to obtain date/value pairs. I saw things including "List", which didn't work. Anyhow, I think we're saying the same thing about // Normal and date value pairs. I'm going to review the other examples you provided tonight to understand the different applications of Normal.

I was using the search function on Wolfram as a learning tool, copying and pasting some examples into a notebook, but sometimes they wouldn't run when I entered information such as dates: Your examples are very helpful for learning the formatting which differs from the cut and paste examples I used.

I've tried some tutorials and seem to do okay with the examples, but I'm not yet able to apply the skills when defining my own searches. I will have to put more time aside to review interactive book, too. I have zero programming knowledge. But this looks amazing! I have so many things that I want to try, but I need to learn the language first.

Once again, thanks for your thorough guidance on these examples and learning tools. Very helpful and much appreciated.

Regards, Rachel

POSTED BY: Rachel Brown
Posted 2 years ago

Hi Rohit and Community,

I'm still working on understanding how extract values from time series in graphical form. I've tried using the example from above with Financial Indicators, such as Rate Of Change and RSI, and it doesn't seem to work. Using Rate Of Change as an example, the time series shows closing values of the stock instead of closing Rate Of Change values.

data = FinancialData["IBM", {{2022, 1, 1}, {2022, 9, 1}}, "Close"]
RateOfReturn5 = RateOfReturn[data, 5]
DateListPlot[RateOfReturn5]

I used an example from the interactive book, but I'm still stuck on how to extract the actual daily closing values of a financial indicator from the chart.

TradingChart[{"MSFT", {{2009, 1, 1}, {2009, 3, 
    31}}}, {"RateOfChange", 5}]

Would anybody be able to point me in the right direction on how to extract the actual daily closing values of a financial indicator from a chart or time series?

Thank you.

Rachel

POSTED BY: Rachel Brown
Posted 2 years ago

*****Correction to the above code in the first example (RateOfChange, not RateOfReturn)

data = FinancialData["IBM", {{2022, 1, 1}, {2022, 9, 1}}, "Close"]
RateOfChange50 = RateOfChange[data, 50]
DateListPlot[RateOfChange50]
POSTED BY: Rachel Brown
Posted 2 years ago

Hi Rohit,

Thank you once again. I'm such a beginner that I have to work through the examples many times to understand. I was thinking that Moving Average is a financial indicator, but now I see it's in the drop down list, which means it's built-in WL. Whereas RateOfChange is not in the drop down list. I'm going to practice more tonight. Very grateful for your help on this..

POSTED BY: Rachel Brown
Reply to this discussion
Community posts can be styled and formatted using the Markdown syntax.
Reply Preview
Attachments
Remove
or Discard

Group Abstract Group Abstract