Message Boards Message Boards

0
|
3697 Views
|
17 Replies
|
7 Total Likes
View groups...
Share
Share this post:

Is there a way to view a graph of 2 functions in real time?

Posted 1 year ago

Is there an easy way to get different views of the graph? I made 2 graphs that intersect at y=zero.

I compare it to a graphing calculator that lets you trace the curve or view intersections or intercepts.

I am using large numbers, so the task is more complex. But I have seen instructors use a “real-time” graph for differential equations. I need that tool on a regular y=(N^2)/x.

Here are my equations. Changing the range is time-consuming. I want Mathematica or Wolfram|Alpha to let me analyze the graph easily.

plot((x^4/(N^2+x)), ((N^2/x+x^2)/N*x-N), where y=0

https://www.wolframalpha.com/input?i2d=true&i=plot%5C%2840%29Divide%5BPower%5Bx%2C4%5D%2C%5C%2840%29Power%5B2564855351%2C2%5D%2Bx%5C%2841%29%5D%5C%2841%29%5C%2844%29+%5C%2840%29Divide%5B%5C%2840%29Divide%5BPower%5B2564855351%2C2%5D%2Cx%5D%2BPower%5Bx%2C2%5D%5C%2841%29%2C2564855351%5D*x-2564855351%5C%2841%29+where+y%3D0

POSTED BY: Bobby Joe Snyder
17 Replies

Please post code, not images.

The plot is accurate, the expression value is highly oscillatory and negative in the plotted domain.

ClearAll[eq1, x];
eq1 = -2564855351 + 2564855351 Sqrt[2564855351] x Sqrt[1/(x + 2564855351 x^2)]

values = Table[{x, N@eq1}, {x, 41223, 41281}]
values = Table[{x, N@eq1}, {x, 41223, 41281, .05}]

Extend the domain

Plot[eq1, {x, 1000, 100000}, PlotRange -> All]

The expression is never >=0, its limit is 0 as x -> Infinity

Limit[eq1, x -> Infinity]
POSTED BY: Rohit Namjoshi

This screenshot gives an equation that will solve for the 2 Semi-Prime factors that make up 2564855351. Yes I know they are already known. It is for proof of concept. Where y equals zero x is the smaller factor of the equation. We graph to reveal (test) this.

I don't understand the error perfectly, but at 41227, the graph should be zero. Mathematically you can plug and chug values and test, but I believe 41227 can be isolated rather fast. So the method is useful and is a step in the right direction for Prime factorization.

Can anyone guide me on how to draw this graph to match what the numbers say is the graph? The graph looks like a barcode and not a one to one graph. It is the same graph I used earlier with a factors of error. In that graph y equaled 0.38 where x was 41227.

If I did not explain this enough, tell me and I will explain further. Thanks.

Equation and Graph

POSTED BY: Bobby Joe Snyder

Thanks for all your help. Are you guessing and checking or is there a function that tells where graphs intersect.

In the Pappy Craylar Conjecture (the last two graphs I posted) the smaller Prime factor occurs when y is between zero and one.

My question is: With the number of values between one and zero. Is the Pappy Craylar Conjecture useful. Obviously Mathematica knows the factor and can factor it in seconds. But if N was larger than what Mathematica could factor would the PCC be useful?

For and N of 2564855351, testing odd values between 50,000 and 41,227 is around 4,000 values. (Note that in the Mathematica Notebooks, I called “N” pnp to prevent conflict.) I can plug in a known x with pnp and it checks, but I cannot solve the equation with knowing pnp alone, because it results in imaginary number values. But are there equations that show the relationships in Prime numbers like the PCC equations do?

And thanks again

POSTED BY: Bobby Joe Snyder

Not sure what you mean by

The problem is that more than just the Prime factor come close. I would have to test from 50,000 to 41,000

eq1 = ((x*Sqrt[pnp^3/(pnp*x^2 + x)] + x^4/(pnp^2 + x)) - pnp)
eq2 = (Sqrt[((((x^2*pnp^4 + 2*pnp*x^5) + x^8)/pnp^4)*pnp^2/x^2)] - pnp)

Plot[{eq1, eq2}, {x, 500, 10000},
 PlotRange -> All,
 PlotLabels -> "Expressions"]

enter image description here

FindRoot[eq1 == eq2, {x, 5000}]
(* {x -> 5064.549946} *)

The curves intersect at ~5064.55

POSTED BY: Rohit Namjoshi

This is the corrected equations. Should meet at 41,000 (the Prime factor). Comes within 0.2 units. The problem is that more than just the Prime factor come close. I would have to test from 50,000 to 41,000. I would have to test 4,500 values. Less than 10^9. But still large.

POSTED BY: Bobby Joe Snyder

Please edit your response and add the correct equations in a form that can be copied and pasted into a notebook.

POSTED BY: Rohit Namjoshi

enter image description hereThanks everyone that was extremely helpful. I fixed the one equation. But I was crunching numbers to see why I couldn’t get the graph to intersect. Your corrections say it all. I am getting the two separate graphs to come to 0.2, close at 41,000. But they do not intersect. Is there any class or method that can evaluate when they “almost” intersect?

POSTED BY: Bobby Joe Snyder

Why do you think

The should be equal around 41000.

In the domain over which you are plotting the expressions, they are different by 9 orders of magnitude.

ClearAll[x, pnp];
eq1 = ((x*Sqrt[pnp^3/(pnp*x^2 + x)] + x^4/(pnp^2 + x)) - pnp)
eq2 = pnp - (Sqrt[((x^2*pnp^4 + 2*pnp*x^5) + x^8)/pnp^4] - (1 - x^2/(2*pnp)))

pnp = 2564855352;
Plot[{eq1, eq2}, {x, 10000, 50000},
 PlotRange -> All,
 PlotLabels -> "Expressions"]

enter image description here

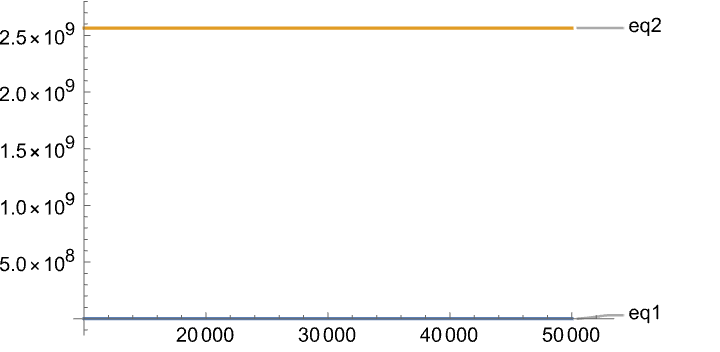
By looking at the two expressions it is clear that they can only be close in magnitude for very large values of x.

Plot[{eq1, eq2}, {x, 9000000, 10000000},
 PlotRange -> All,
 PlotLabels -> "Expressions"]

enter image description here

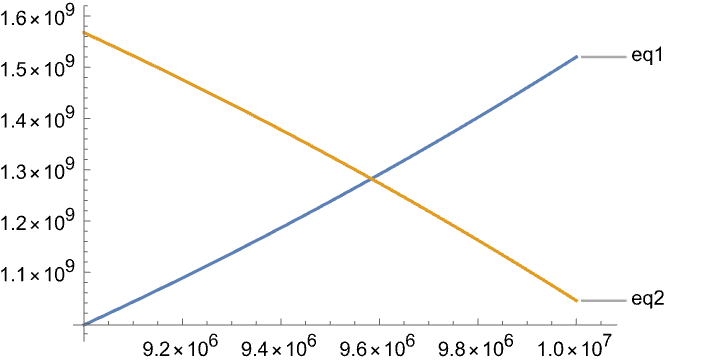
FindRoot[eq1 == eq2, {x, 10000000}, WorkingPrecision -> 10]
(* {x -> 9.583792130*10^6} *)

Which is not ~41000.

WL is case-sensitive, this does nothing and returns unevaluated. Should be Clear.

clear[x, pnp]
POSTED BY: Rohit Namjoshi


This is supposed to factor SemiPrimes. PNP is the semi-Prime and x is the factor.

POSTED BY: Bobby Joe Snyder

enter image description here

This is what I attempted to do. The problem is the graphs don't equal exactly. The should be equal around 41000.

POSTED BY: Bobby Joe Snyder

Also in Print[ii], ii is not defined, should probably be Print[i], and the parenthesis are not balanced. With i = 3 the test provided to While fails because of the < condition, perhaps you meant <=.

POSTED BY: Rohit Namjoshi
Posted 1 year ago

Well, this is a mess. You're not using the correct symbols.

  • Mathematica is case-sensitive
  • << should probably be <
  • the [Dash] should probalby be -

Please get the code to be at least syntactically correct before asking us to debug it.

POSTED BY: Eric Rimbey

Why won't this loop?

clear [i, pnp]

pnp= 2564855351


i=3; while[  ((((pnp^2/i + i^2) / pnp * i) – (i^3/pnp)) << pnp, Print[ii]; i=i+2]
POSTED BY: Bobby Joe Snyder
g[N_] := (N^2/x + x^2)/N*x == 2564855351

I want the value of x when y=2564855351 (That is y is G[x] and y equals N of the SemiPrime.

I thought the equation would give an estimate of a factored SemiPrime.

But the numbers aren’t exact. There is error. I thought I could graph 2 graphs and the intersection would be a good estimate. But the smallest error in N=N cause the computer to not be able to give me the estimate of x, where y equals N.

POSTED BY: Bobby Joe Snyder
Posted 1 year ago

I'm not sure I entirely understand what you're asking for, but if you want to find where two functions intersect, you might just try using Solve:

f[N_] := x^4/(N^2 + x);
g[N_] := (N^2/x + x^2)/N*x - N;
Solve[f[10] == g[10], x]
(* {{x -> 0}, {x -> 0}, {x -> 0}, {x -> 100/9}} *)

With that you could determine where to focus your plot, or maybe add some visualization that highlights the intersections.

POSTED BY: Eric Rimbey

I want a feature that will tell me the point 2 graphs intersect.

It seems simple enough, but I don’t know of any way to draw the graph without changing the range. But with numbers of hundred digits, Mathematica draws the graph in seconds, but finding one specific point in a million is difficult.

I guess it does draw the graph in real-time, but I want views in different ranges over the graph.

I could put y=0 in the domain, but with large numbers, the scale of the graph is off.

I don’t know any solution except maybe writing a loop and comparing the equations.

I was just hoping there is something simple I haven’t learned yet.

POSTED BY: Bobby Joe Snyder
Posted 1 year ago

Can you be more specific about what views you want? I guess I don't know what a "real time" graph is. I also don't know what "I need that tools on a regular..." means.

POSTED BY: Eric Rimbey
Reply to this discussion
Community posts can be styled and formatted using the Markdown syntax.
Reply Preview
Attachments
Remove
or Discard

Group Abstract Group Abstract