Message Boards Message Boards

0
|
1511 Views
|
5 Replies
|
6 Total Likes
View groups...
Share
Share this post:

ListPlot of Farey Sequence

Posted 1 year ago

Hello everyone,

I am trying to ListPlot[] the FareySequence[] command. I need to find the first 70 terms of this sequence. I've been trying really hard by using Table[] to create the function first. Then, I have no idea how to do so. Please help me.

This is also the link I found may help https://debraborkovitz.com/2012/06/farey-fraction-visual-patterns/

POSTED BY: serene H
5 Replies
Posted 1 year ago

Thank you for your kindness.

POSTED BY: serene H

I am sure many of you have spotted the mathematical nonsense of my coding above - as it occurred to me in a sleepless night. What is wanted is of course, the numbers of a single sequence (here e.g., FareySequence[70]) plotted according to their values and their denominators:

maxVal = 70;
fareyPoints = {#, Denominator[#]} & /@ FareySequence[maxVal];
Plot[{1/x, 1/(1 - x)}, {x, 0, 1}, PlotStyle -> Red, PlotRange -> {0, maxVal}, Epilog -> Point[fareyPoints], ImageSize -> Large]

Now basically, we have a short one-liner!

@chiao-yin hsu: The problem in your code is that you are plotting 70 sequences but without deleting the duplicates - as I did in my first approach (by using the complements successively).

POSTED BY: Henrik Schachner
Posted 1 year ago

Hi,

Thank you for your help.

I tried to simplify the answer by using

maxVal = 70;
fareyData =  Table[{FareySequence[n][[i]], n}, {n, 1, maxVal}, {i, 1,  Length[FareySequence[n]]}]
ListPlot[fareyData]
pl = Plot[{1/x, 1/(1 - x)}, {x, 0, 1}, PlotRange -> {0, maxVal}, PlotStyle -> Black];

It turns out the graph is not the same. Could someone help me with the code I wrote? Thank you.

POSTED BY: serene H

Hello Chiao-Yin Hsu,

according to the reference you cited, this is probably the graphics you are asking for:
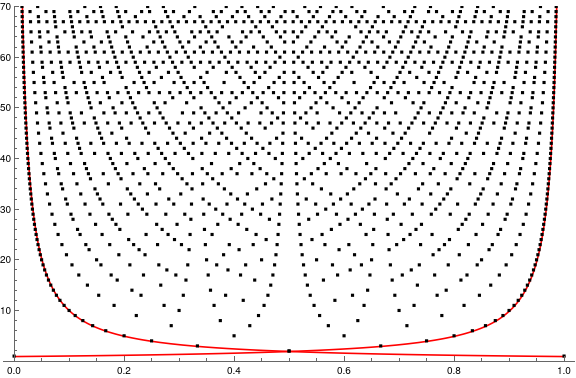
maxVal = 70;
fareyData0 = Table[FareySequence[n], {n, 1, maxVal}];
fdp2 = Reverse /@ Partition[fareyData0, 2, 1];
fareyData1 = Complement @@@ fdp2;
fareyData = MapIndexed[Thread[{#1, #2} &[#1, First[#2]]] &, Prepend[fareyData1, {0, 1}]];
fp = ListPlot[fareyData, PlotStyle -> Black];
pl = Plot[{1/x, 1/(1 - x)}, {x, 0, 1}, PlotRange -> {0, maxVal}, PlotStyle -> Red];
Show[pl, fp, ImageSize -> Large]

enter image description here

ADDENDUM: If you just want to see the points you can simply do it like so:

NumberLinePlot[fareyData1, PlotStyle -> Black, ImageSize -> Large]
POSTED BY: Henrik Schachner
Posted 1 year ago

There are no "first 70 terms" of the Farey sequence. There is a separate Farey sequence for each integer. FareySequence[15] has 73 terms, so maybe that's the one you want to plot. You can do that simply with,

ListPlot[FareySequence[15]]

enter image description here

POSTED BY: Eric Rimbey
Reply to this discussion
Community posts can be styled and formatted using the Markdown syntax.
Reply Preview
Attachments
Remove
or Discard

Group Abstract Group Abstract