Hello Chiao-Yin Hsu,
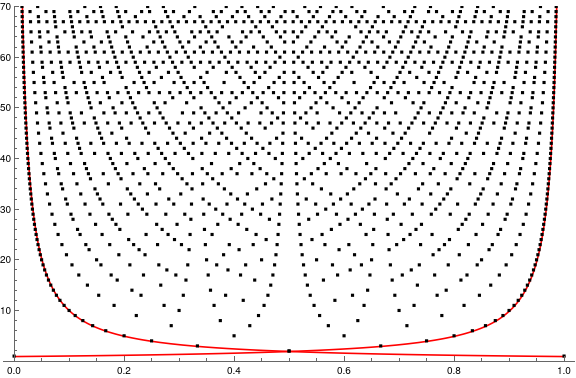
according to the reference you cited, this is probably the graphics you are asking for:
maxVal = 70;
fareyData0 = Table[FareySequence[n], {n, 1, maxVal}];
fdp2 = Reverse /@ Partition[fareyData0, 2, 1];
fareyData1 = Complement @@@ fdp2;
fareyData = MapIndexed[Thread[{#1, #2} &[#1, First[#2]]] &, Prepend[fareyData1, {0, 1}]];
fp = ListPlot[fareyData, PlotStyle -> Black];
pl = Plot[{1/x, 1/(1 - x)}, {x, 0, 1}, PlotRange -> {0, maxVal}, PlotStyle -> Red];
Show[pl, fp, ImageSize -> Large]

ADDENDUM: If you just want to see the points you can simply do it like so:
NumberLinePlot[fareyData1, PlotStyle -> Black, ImageSize -> Large]