Message Boards Message Boards

Interactively changing the point in which the tangent is drawn in hyperbola

Posted 1 year ago

Hi everyone,

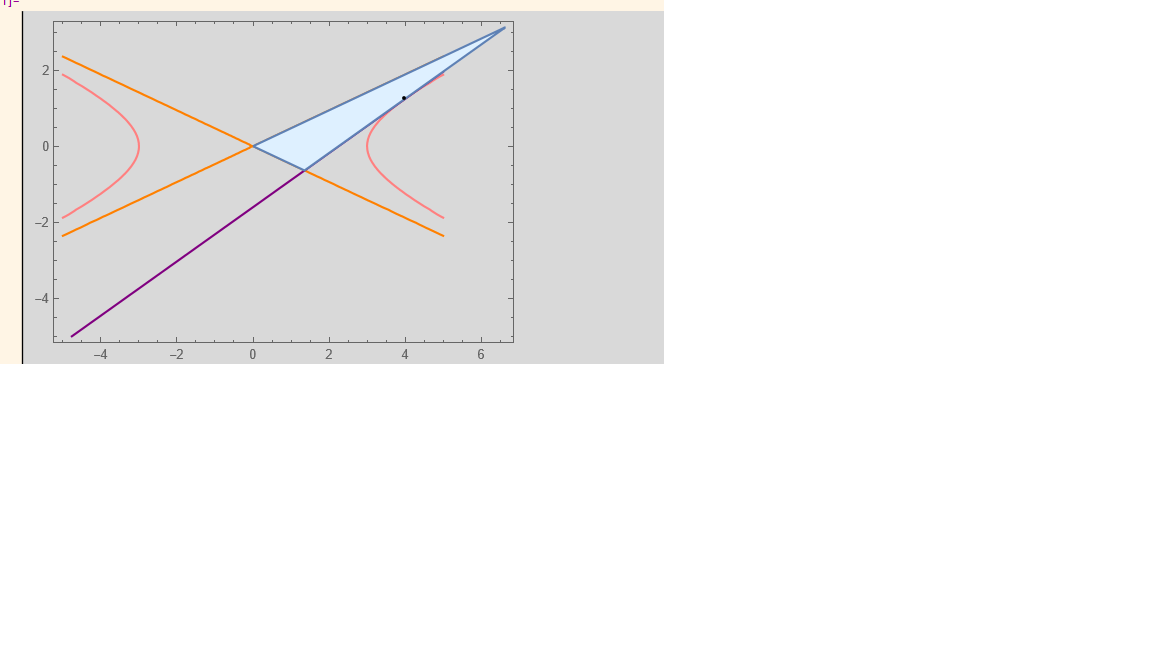
I have a question about how to create a Manipulate[] that allows changing the point in which the tangent is drawn. It should display the hyperbola, the asymptotes, the tangent the resulting triangle.

the hyperbola of equation is x^2/9-y^2/2=1

I already made the split and the asymptotes and the tangent Here is my code

hb = Solve[x^2/9 - y^2/2 == 1 && x > 0 && y > 0, Reals];
{x0, y0} = {x, y} /. First@hb /. x -> 4;

(*asymptotes formula = (x^2/a^2)-(y^2/b^2)=0*)
(*tangent line at point (x0,y0) --> xx0/a^2-yy0/b^2)=2 *)

contours = 
  ContourPlot[{x^2/9 - y^2/2 == 1, x^2/9 - y^2/2 == 0, 
    x*x0/9 - y*y0/2 == 1}, {x, -5, 5}, {y, -5, 5}, 
   Epilog -> {Black, Point[{x0, y0}]}, AspectRatio -> Automatic, 
   ContourStyle -> {Pink, Orange, Purple}];
region = 
  ImplicitRegion[{x^2/9 - y^2/2 <= 1, x^2/9 - y^2/2 >= 0, 
    x*x0/9 - y*y0/2 <= 1}, {{x, 0, 10}, {y, -10, 10}}];

plotreg = RegionPlot[region, PlotStyle -> LightBlue];

Show[contours, plotreg, PlotRange -> All]

enter image description here

POSTED BY: serene H
3 Replies

Here is a way:

hb[t_] = 
  y0 /. Solve[t^2/9 - y0^2/2 == 1 && y0 > 0 && t > 0, y0][[1]];
Manipulate[With[{y0 = hb[x0]},
  Show[ContourPlot[{x^2/9 - y^2/2 == 1, x^2/9 - y^2/2 == 0, 
     x*x0/9 - y*y0/2 == 1}, {x, -5, 5}, {y, -5, 5}, 
    Epilog -> {Black, Point[{x0, y0}]}, AspectRatio -> Automatic, 
    ContourStyle -> {Pink, Orange, Purple}],
   RegionPlot[
    ImplicitRegion[{x^2/9 - y^2/2 <= 1, x^2/9 - y^2/2 >= 0, 
      x*x0/9 - y*y0/2 <= 1}, {{x, 0, 10}, {y, -10, 10}}], 
    PlotStyle -> LightBlue]]],
 {x0, 3.01, 6}]
POSTED BY: Gianluca Gorni
Posted 1 year ago

Hi, the code doesn’t work somehow. I’ve tried to revise the code as well.

POSTED BY: serene H

Perhaps you didn't clean the variables first:

Clear[hb, x0, y0];
hb[t_] := y0 /. Solve[t^2/9 - y0^2/2 == 1 && y0 > 0 && t > 0, y0][[1]];
Manipulate[
 With[{y0 = hb[x0]}, 
  Show[ContourPlot[{x^2/9 - y^2/2 == 1, x^2/9 - y^2/2 == 0, 
     x*x0/9 - y*y0/2 == 1}, {x, -5, 5}, {y, -5, 5}, 
    Epilog -> {Black, Point[{x0, y0}]}, AspectRatio -> Automatic, 
    ContourStyle -> {Pink, Orange, Purple}], 
   RegionPlot[
    ImplicitRegion[{x^2/9 - y^2/2 <= 1, x^2/9 - y^2/2 >= 0, 
      x*x0/9 - y*y0/2 <= 1}, {{x, 0, 10}, {y, -10, 10}}], 
    PlotStyle -> LightBlue]]], {x0, 3.01, 6}]

It works fine for me on both version 12.0 and 13.1.

POSTED BY: Gianluca Gorni
Reply to this discussion
Community posts can be styled and formatted using the Markdown syntax.
Reply Preview
Attachments
Remove
or Discard

Group Abstract Group Abstract