Message Boards Message Boards

0
|
2054 Views
|
6 Replies
|
1 Total Likes
View groups...
Share
Share this post:

Why won't Mathematica plot this?

Posted 1 year ago

I need to use Mathematica to plot the sum (image attached) but for some reason when I hit run nothing happens. Is there some small mistake I made that I'm overlooking?

POSTED BY: Sydney Strong
6 Replies
Posted 1 year ago
Plot3D[u[x, y, 50], {x, 0, 1}, {y, 0, 1}]
POSTED BY: Eric Rimbey

Give a value to m (it is blue, so nothing is assigned to it)

POSTED BY: Mads Bahrami
Posted 1 year ago

What would be the syntax for that? I have tried {x, 0,1}, {y,0,1}, {m, 50} and {x, 0,1}, {y,0,1}, {50} as well as {x, 0,1}, {y,0,1}, {m = 50}.

POSTED BY: Sydney Strong
Posted 1 year ago

Thank you, sorry if that was a very trivial question. Unfortunately the code still won't work, but at least I have that one issue solved.

POSTED BY: Sydney Strong

Hi Sydney,

u is of the form Sum[expression, {m, n = 1}]. The syntax for the limits is incorrect. Check the documentation for Sum.

POSTED BY: Rohit Namjoshi
Posted 1 year ago

That's weird. It works for me. Given Rohit's comment, I think there must be some copy-paste weirdness. If you just use simple InputForm, I think you can avoid that:
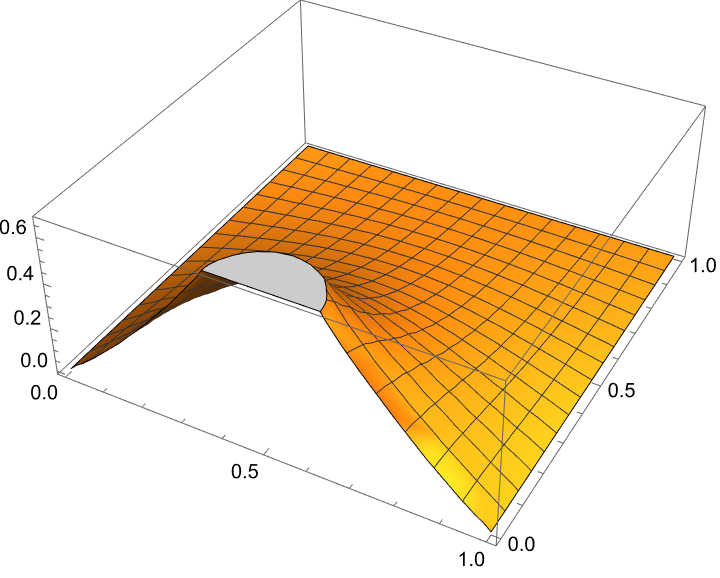
u[x_, y_, m_] := 
 Sum[(2/Sinh[n*Pi])*((1/(n*Pi)^2)*Sin[(n*Pi)/2] + (1/(n*Pi))*
      Sin[(n*Pi)/2])*Sin[n*Pi*x]*Sinh[(1 - y)*n*Pi], {n, 1, m}];
Plot3D[u[x, y, 50], {x, 0, 1}, {y, 0, 1}]

enter image description here

POSTED BY: Eric Rimbey
Reply to this discussion
Community posts can be styled and formatted using the Markdown syntax.
Reply Preview
Attachments
Remove
or Discard

Group Abstract Group Abstract