Message Boards Message Boards

0
|
1807 Views
|
7 Replies
|
3 Total Likes
View groups...
Share
Share this post:

Plot data from two tables when the x values are in the second column

Posted 1 year ago

I have two tables like this (this is just a part of the data)

dataPairs1 = {{2.9, 0.011058}, {3.1, 0.135039}, {3.3, 0.28581}, {3.5, 
  0.49116}, {3.7, 0.784771}, {3.9, 1.20622}, {4.1, 1.79587}}

dataPairs2 = {{2.9, 5.98461}, {3.1, 7.06365}, {3.3, 7.93918}, {3.5, 8.60008}, {3.7,
   9.07171}, {3.9, 9.3948}, {4.1, 9.60995}} 

and I can if needed put them in table form e.g.
enter image description here

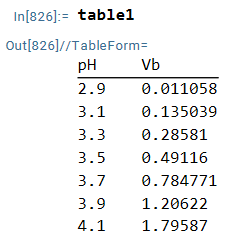
What I am trying to do is plot pH values on the y-axis against Vb values on the x-axis and I would need to specify the y-axis range as 0-14 and the x-axis range as 0-20..
Both data sets need to be on the same plot/axes.

Any help will be much appreciated,

POSTED BY: Paul Newton
7 Replies
Posted 1 year ago

I'm trying to take your description literally, and this is what I come up with:

ListPlot[{Reverse[dataPairs1, 2], Reverse[dataPairs2, 2]}, PlotRange -> {{0, 20}, {0, 14}}]

enter image description here

Based on how that looks, I'm guessing that I misinterpreted something. But maybe there is enough there for you to fiddle with until you get what you want.

POSTED BY: Eric Rimbey
Posted 1 year ago

Regarding levels:

In short, each expressions in Mathematica is ultimately a tree. A level is all of the sub-expressions at a particular depth in the tree (usually). You can use Level to extract a level (or levels). Just be careful, because the documentation can sometimes be "loose" with the term "level"--sometimes it means a literal Level and sometimes it's more like depth. Also be careful about negative levels, which count up from the bottom of the expression tree (so for unbalanced trees the sub-expressions at the same negative level won't be at the same depth). Anyway, it's too much info to put into a reply. You'll need to read the documentation and play around with examples.

POSTED BY: Eric Rimbey
Posted 1 year ago

As far as I know, Plot will always be arranged with the independent variable on the horizontal axis (but I honestly wouldn't be surprised if I were wrong and there is some option that affected this). So, you either need to find the inverse function or use your function to generate a list of points that you can deal with like we already did with your dataPairs1 example.

For completeness, I'll mention that you might be able to extract the data from the underlying Graphics expression that Plot produces. You could manipuate that raw data and create a new plot. But this would be a desperate last resort.

POSTED BY: Eric Rimbey
Posted 1 year ago

That's exactly what I wanted - many, many thanks. You haven't misinterpreted anything, it just looks strange because I only gave you the start of the data, In practice the pH values range from 2.9 to 12.5 and then it looks more sensible Plot with all data

Presumably, I can now modify ListPlot to do things like

  • Adjust line and marker styles and colours
  • Add axis titles
  • Add gridlines
  • Add a plot title
  • Add a legend
  • Change axis labels fonts and sizes

and anything else I can think of? If so, it will then just be a case of finding where all these options are in the documentation - shouldn't be too difficult.

POSTED BY: Paul Newton
Posted 1 year ago

I have checked the documentation but I am still not clear why ",2" is needed in Reverse[dataPairs1,2] I know it means reverse the elements at level 2 but what is level 2 ?

Also, in the same document I have

Plot[Vb[pH, Ca, Cb, pKa, pKb, Kw, Va], {pH, 2.9, 12.5}]

but again the axes are the "wrong" way round. Vb comes from

  Vb[pH_, Ca_, Cb_, pKa_, pKb_, Kw_, Va_] := 
   Va*((Ca/(1 + H[pH]/Ka[pKa])) - H[pH] + 
       Kw/H[pH])/((Cb/(1 + Kw/(H[pH]*Kb[pKb]))) + H[pH] - Kw/H[pH])

Is this enough or should I attach my document? Thank you.

POSTED BY: Paul Newton
Posted 1 year ago

Thank you. I did take a look at those links and, to be honest, levels are something that I probably won't need to concern myself with. Having said that, I can see myself possibly having a use for the Head function. I'll reply to your post about plots separately.

POSTED BY: Paul Newton
Posted 1 year ago

Plot will always be arranged with the independent variable on the horizontal axis Blockquote

I suspected as much. Finding the inverse function is what I am effectively doing in a second document. The first and simpler document derives Vb from pH (i.e. input pH values, output Vb values). The second document does the opposite. I'll stick with generating a list of points ...

Life is too short for me even to consider your last suggestion - that would indeed be a desperate last resort.

Thanks again!

POSTED BY: Paul Newton
Reply to this discussion
Community posts can be styled and formatted using the Markdown syntax.
Reply Preview
Attachments
Remove
or Discard

Group Abstract Group Abstract