Message Boards Message Boards

1
|
1778 Views
|
1 Reply
|
4 Total Likes
View groups...
Share
Share this post:

How do you add a date scale along the bottom of a list plot?

I have a plot of the battles in which Ulysses S. Grant was a commander.
I would like to place the dates of the battles with ScalingFunctions -> "Date" for the horizontal axis but for some reason, the dates do not appear correctly. I would like to plot the years and possibly quarters of a year or by months.
Is there a way to make the dates appear in my list plot?

POSTED BY: Peter Burbery

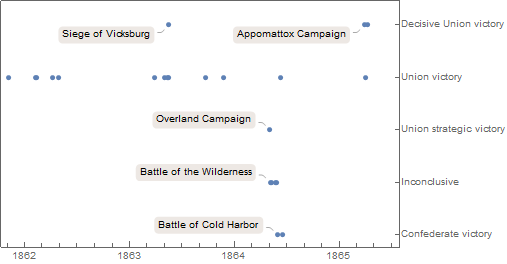
DateListPlot version

DateListPlot[data, Joined -> False, 
 FrameTicks -> {{None, tickLabels}, {Automatic, None}}]

enter image description here

ordinalScale = 
  AssociationThread[{"Confederate victory", "Inconclusive", 
     "Union strategic victory", "Union victory", 
     "Decisive Union victory"} -> {-1, 0, 1, 2, 3}];
tickLabels = KeyValueMap[List /* Reverse, ordinalScale];
topOutcomes = Query[
    DeleteMissing /* KeySortBy[DateObject[#["StartDate"], "Day"] &],
    First /* (ordinalScale@# &)
    ]@EntityValue[UlyssesSGrantBattles, "OutcomeNotes", 
    "EntityAssociation"];
battleDates = KeyMap[DateObject[#["StartDate"], "Day"] &, topOutcomes];
data = Rule[TimeSeries[battleDates], Keys[topOutcomes]];
Reply to this discussion
Community posts can be styled and formatted using the Markdown syntax.
Reply Preview
Attachments
Remove
or Discard

Group Abstract Group Abstract