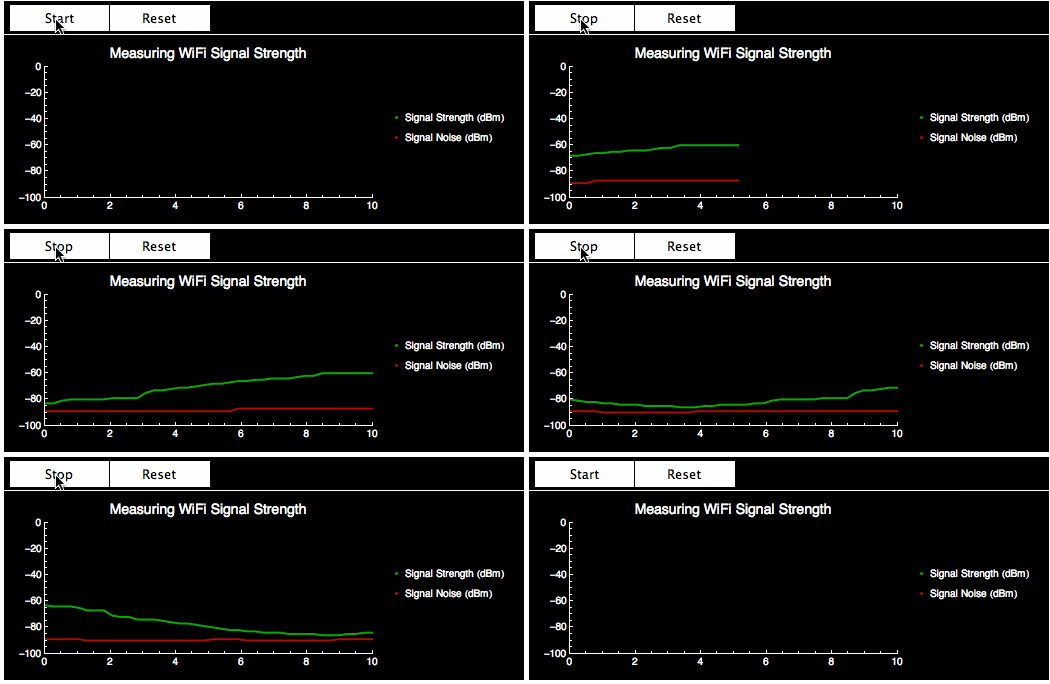
Inspired by this Stack Exchange answer from @rm-rf, and question of @dmurta , I created this simple WiFi signal monitor with Wolfram Language. It works just for MAC, but I believe that a Windows version would be not too hard to implement. It's a cool way to test your WiFi signal in different places of your house or office.
In this gif, I have moved to far and then to near from my WiFi base station. The Notebook is available below. Code suggestions/improvement are always welcome.

Here is the code:
getSignal[]:=Module[{data},
    data=ReadList["!/System/Library/PrivateFrameworks/Apple80211.framework/Versions/Current/Resources/airport -I","String"];
    data=Rule@@StringSplit[StringReplace[StringTrim@#," "-> ""],":",2]&/@data;
    data[[All,2]]=If[StringMatchQ[#,NumberString],Internal`StringToDouble[#],#]&/@data[[All,2]];
    data
]
(*dd=getSignal[]*)

plot[data_]:=ListPlot[Transpose@data
       ,PlotRange->{{0,10},{-100,0}}
       ,AxesOrigin->{0,-100}
       ,Joined->True
       ,PlotStyle->{Directive[Darker@Green,Thick],Directive[Darker@Red,Thick]}
       ,Background->Black
       ,AxesStyle->White
       ,DataRange->{0,10}
       ,AspectRatio->0.4
       ,BaseStyle->{FontFamily-> "Helvetica"}
       ,PlotLegends->(Style[#,White,FontFamily->"Helvetica"]&/@{"Signal Strength (dBm)","Signal Noise (dBm)"})
       ,PlotLabel->Style["Measuring WiFi Signal Strength",14,White]
]//Panel[#,Background->Black]&
(*plot[RandomInteger[{-100,0},{40,2}]]*)

wiFiMonitor[]:=DynamicModule[{data,runQ=False},
    data=ConstantArray[Null,{40,2}];
    Dynamic[
     Refresh[
        If[runQ,data=Most@Prepend[data,{"agrCtlRSSI","agrCtlNoise"}/.getSignal[]]] (*RSSI - Received Signal Strength Indication*)
       ;Deploy@Grid[{
           {Row@{Button[Dynamic[If[runQ,"Stop","Start"]],runQ=Not@runQ,Background->White,ImageSize->100],Button["Reset",data=ConstantArray[Null,{40,2}],Background->White,ImageSize->100]}}
          ,{plot[data]}}
          ,Background->Black
          ,Dividers->White
          ,Alignment->Left
         ]
    ,UpdateInterval->0.25
    ,TrackedSymbols->{}]
    ]
    ,SaveDefinitions->True
]
wiFiMonitor[]
 Attachments: