Message Boards Message Boards

0
|
4489 Views
|
2 Replies
|
2 Total Likes
View groups...
Share
Share this post:

Tabulated output from a computation

Posted 10 years ago

I have determined the results from a parametric integration, I want to know how to get a tabulated numerical (x, y) output. I can get the "y" values but can't get the (x, y) listed output.

luke

Attachments:
2 Replies

First, there is no need to call integrate each time for different f. Evaluate the integral outside the Table and it be a function of f, then simply evaluate for different f. Much faster. Only case to worry about is zero value, for this need to take the limit. But this is much faster than calling Integrate each time. For the plot, simply use Table with {x,y} in it, like this

int = Integrate[Exp[-a (2 \[Pi] f \[Eta] L)/U ] L  , {\[Eta], 0, 1}]; (*integrate once*)
g[x_] := If[x == 0, Limit[int, f -> 0], int /. f -> x];
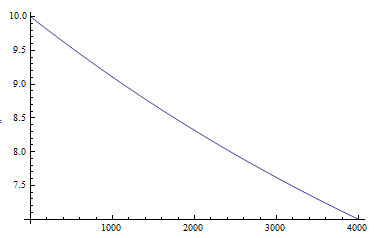
data = Table[{i, g[i]}, {i, 0, 4000}];
ListLinePlot[data]

enter image description here

ps. you use UpperCaseLetter for your variables. Not a good idea since these are reserved for Mathematica and can cause problem sometimes. Better to use lowerCaseLetter

POSTED BY: Nasser M. Abbasi
Posted 10 years ago

Here, by example:

In[15]:= Table[{x, x^2}, {x, 0, 5, 1}]

Out[15]= {{0, 0}, {1, 1}, {2, 4}, {3, 9}, {4, 16}, {5, 25}}

POSTED BY: David Keith
Reply to this discussion
Community posts can be styled and formatted using the Markdown syntax.
Reply Preview
Attachments
Remove
or Discard

Group Abstract Group Abstract