My notebook contains two functions makePlot1 and makePlot2. Which one is used depends on the setting of a variable cMethod. makePlot1 has a single Plot command which plots two data series and I use the following to add a legend to the plot:
cPlotLegends ->
 Placed[LineLegend[{legend1, legend2},
   LegendFunction -> (Framed[#, FrameMargins -> -2,
       Background -> White, FrameStyle -> Directive[Black]] &),
   LegendLayout -> "Row", LegendMarkerSize -> {{8, 8}},
   LabelStyle -> {FontSize -> 10}], {Right, Bottom}]
This works beautifully and produces a legend looking like this 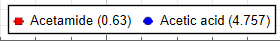 A screenshot of the full plot from makePlot1 is attached (FullPlot.png)
makePlot2 uses CombinePlots to combine two plots and various "decorations" to fine-tune the results. I have tried adding legends to the two plots before combining them, and have also tried adding a legend after the two plots have been combined. If any kind soul would be prepared to take a look at this, I would be very grateful. My notebook and required data (Dissociation constants.TXT) are attached.
I should add that makePlot1 was only intended to be an interim solution and that makePlot2 is what I want finally..
 Attachments:


