Group Abstract Group Abstract

Message Boards Message Boards

0
|
3.3K Views
|
2 Replies
|
2 Total Likes
View groups...
Share
Share this post:

Trying to add a legend when using CombinePlots

Posted 2 years ago
2 Replies
Posted 2 years ago

Hi Paul,

I have not looked at the code in the attached notebook, however, this works fine.

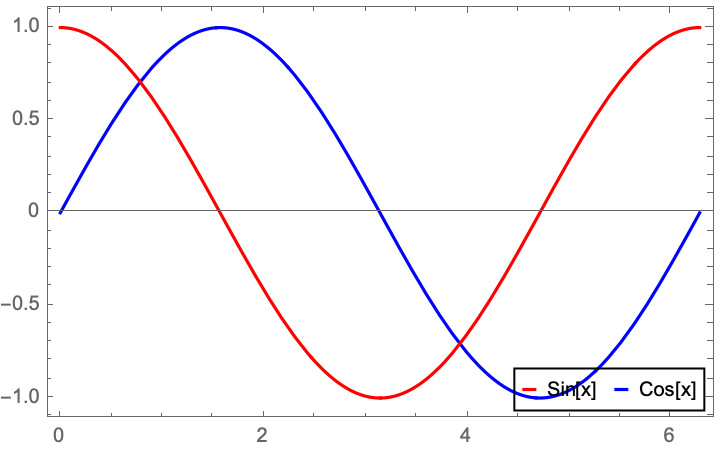
ResourceFunction["CombinePlots"][
 Plot[Sin[x], {x, 0, 2 \[Pi]}, 
  PlotLegends -> 
   Placed[LineLegend[{Red, Blue}, {"Sin[x]", "Cos[x]"}, 
     LegendFunction -> (Framed[#, FrameMargins -> -2, 
         FrameStyle -> Directive[Black]] &), LegendLayout -> "Row",
     LegendMarkerSize -> {{8, 8}},
     LabelStyle -> {FontSize -> 10}], {Right, Bottom}], 
  PlotStyle -> Blue],
 Plot[Cos[x], {x, 0, 2 \[Pi]}, PlotStyle -> Red],
 Frame -> True]

enter image description here

POSTED BY: Rohit Namjoshi
Posted 2 years ago

Thank you very much, Rohit. Following your example I now have it working just fine and I am attaching the revised, working notebook (the previously uploaded notebook actually contained two typos which would have prevented it from working properly under certain circumstances).

Attachments:
POSTED BY: Paul Newton
Reply to this discussion
Community posts can be styled and formatted using the Markdown syntax.
Reply Preview
Attachments
Remove
or Discard