Hi Steven,
Here is one way
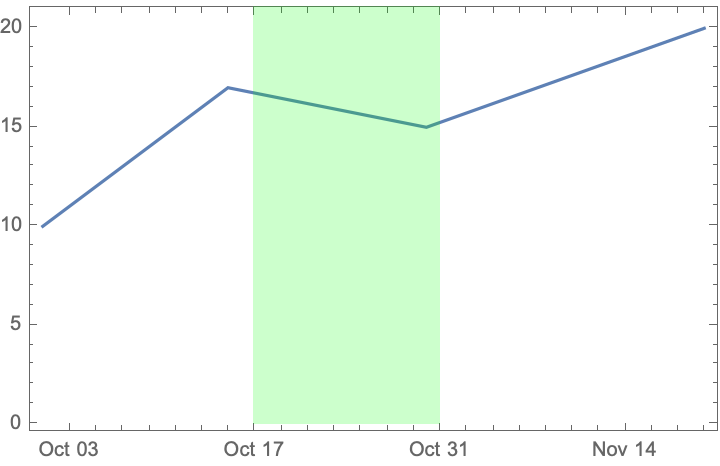
data = {
{DateObject[{2016, 10, 1}, "Day", "Gregorian", -5.`], 10},
{DateObject[{2016, 10, 15}, "Day", "Gregorian", -5.`], 17},
{DateObject[{2016, 10, 30}, "Day", "Gregorian", -5.`], 15},
{DateObject[{2016, 11, 20}, "Day", "Gregorian", -5.`], 20}}

(* Change the bounds of the rectangle to span the area of interest to you *)
epilog = {Opacity@.2, Green,
  Rectangle[{DateObject[{2016, 10, 17}], 0}, {DateObject[{2016, 10, 31}], 25}]};

DateListPlot[data, Epilog -> epilog]