Message Boards Message Boards

0
|
2194 Views
|
8 Replies
|
4 Total Likes
View groups...
Share
Share this post:

Plotting piecewise function?

Posted 1 year ago
POSTED BY: Scott B
8 Replies
Posted 1 year ago
POSTED BY: Scott B
Posted 1 year ago
POSTED BY: Eric Rimbey
Posted 1 year ago

OK so I figured out what I wasn't doing correctly. Apparently you have to hit "shift" while you hit "enter". Now it's graphing and solving things and that seems to be causing the blue In and Out to come up.

Those blue in and outs threw me off too because they look like some kind of mathematical structure.

POSTED BY: Scott B
Posted 1 year ago
POSTED BY: Scott B
Posted 1 year ago

How do I insert an "input" variable? Or an "output"?

I don't know what you mean by this. But regardless, coming to this forum with such questions is probably not going to help you much. Your questions are just too basic to even begin to explain via this sort of bulletin-board back-and-forth. Find a buddy in your class that already has some Mathematica knowledge. Or raise the issue with your instructor. Or start reading the introductory book Rohit liniked to. Seriously, this is like trying to teach someone to drive using only text messages.

POSTED BY: Eric Rimbey
Posted 1 year ago

This is all good information. I'm surprised we have to work with this for a fundamental Calc I class. Most of those are just math?

How do I insert an "input" variable? Or an "output"?

Any screen shot with what I need to use, circled, would be helpful. Otherwise, this seems to make sense, even though I can't understand why I'd need this instead of Desmos.

I'm not a technical/programming person here. I need step by step instructions here and struggle with manuals written for computer people. Conversational English is the best way to reach me here!

POSTED BY: Scott B

Please do not link to the documentation when answering my question.

Perhaps you were not aware that the documentation is live. You can modify code in the documentation, evaluate the cell (as Eric described) and see the output. Any changes you make are not saved so experiment freely. E.g from the documentation for Plot

enter image description here

Change the function and the domain

enter image description here

You might want to read Stephen Wolfram's book An Elementary Introduction to the Wolfram Language which is available free online. The exercises are live, enter your solution as Wolfram Language code and it will check if it is correct.

POSTED BY: Rohit Namjoshi
Posted 1 year ago

I should mention that I am used to computer programs that use buttons, not typing things, and I'm not good at all with computer programming languages.

Let's start there. The Wolfram Language is a programming language. Mathematica provides a notebook interface in which you can execute Wolfram Langauge code. So, if you want to make progress with Wolfram/Mathematica, you're going to need to get over this impedence, at least to some degree.

I just want some good, step by step instructions... Say I want to graph f(x) = x^2 + 3....

I could type that function definition right into a Plot expression. You need to tell Plot the domain you want to see, and that's what the {x, -10, 10} bit is. enter image description here

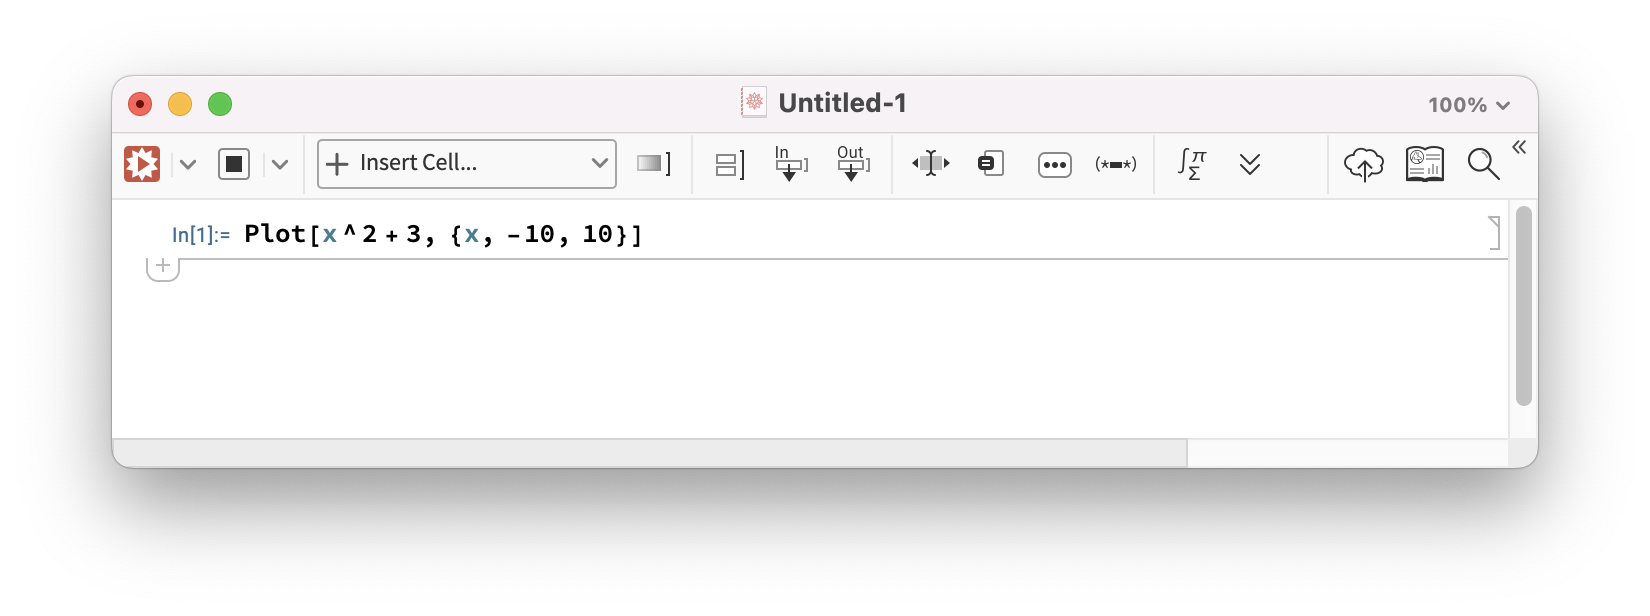
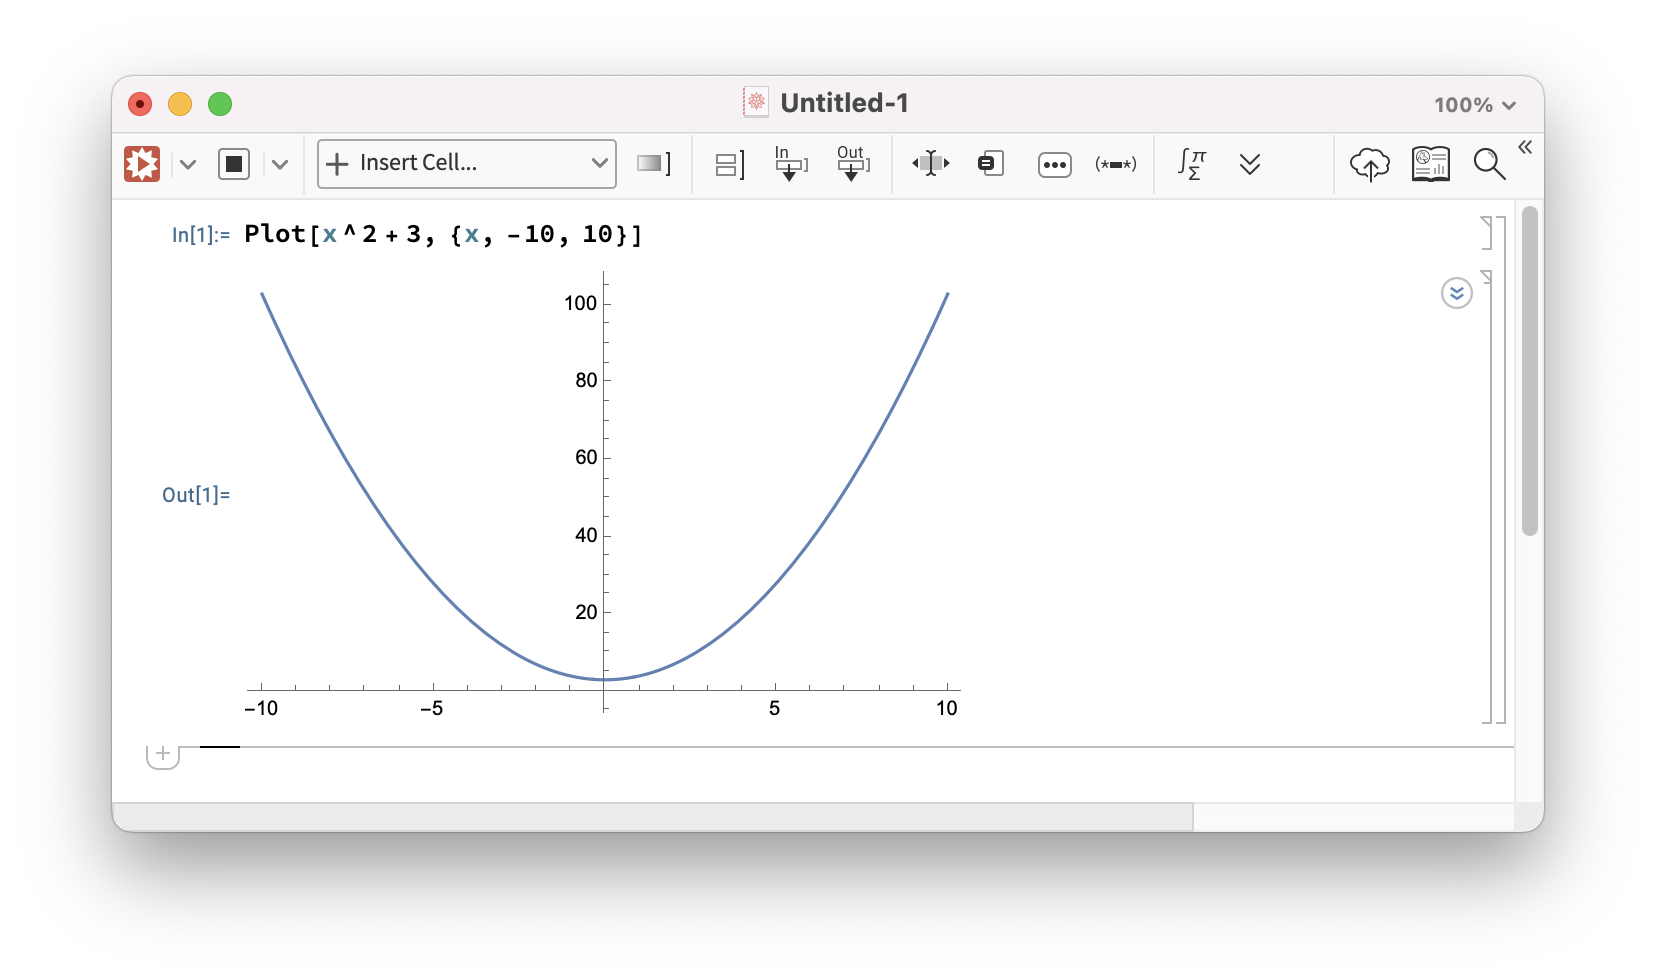
Now, notice the little blue bracket to the right. That is delimiting a cell. On the left, you have a label that's telling you that this is an input cell. The horizontal line is showing you where the cursor currently is, and it's just outside the cell. To get output, you need to evaluate the cell. There is a menu command Evaluation -> Evaluate Cells. There is a shortcut for this: Shift-Return. This command will evaluate all cells that are selected. If your cursor is inside a cell, then this command will evaluate that cell. So, either put your cursor in the cell (click somewhere in/near the Plot expression) or select the cell by clicking on the blue bracket. Now, evaluate the cell. enter image description here

There are a million directions we could go from here. I think the main issue you need to confront is that you're going to be using a programming language and you're going to be creating what are in effect small programs. This means learning the syntax and understanding how evaluation of expressions works, at least at a basic level.

Maybe you should just play around with this Plot for awhile. Edit the contents of that cell by changing the function or the domain limits (you'll need to re-evaluate after each edit to see the effect of your change). Maybe even look at the documentation for Plot if you can bear it--there will be other examples you can try out. Then come back with other questions.

POSTED BY: Eric Rimbey
Reply to this discussion
Community posts can be styled and formatted using the Markdown syntax.
Reply Preview
Attachments
Remove
or Discard

Group Abstract Group Abstract