Message Boards Message Boards

Why "Log10" (ScalingFunctions) is not working?

Posted 1 year ago

Hello,

https://reference.wolfram.com/language/ref/ScalingFunctions.html

enter image description here

Why does the frequency axis not show as described in the documentation by using "Log10"? (ie 10^-3, 10^-2, 10^-1, 10^0, 10^1, 10^2, 10^3,...,10^6)

H = TransferFunctionModel[1/s, s]
Result1 = 
 BodePlot[H[I*2*\[Pi]*freq], {freq, 10^-3, 10^6}, 
  PlotRange -> {{-90, 60}}, PlotLayout -> "Magnitude", 
  ScalingFunctions -> {"Log10", "dB"}, 
  FrameLabel -> {HoldForm[Text[Frequency[Hz]]], 
    HoldForm[Text[Magnitude[dB]]]}, GridLines -> Automatic, 
  PlotStyle -> Thickness[0.005]]

enter image description here

Result2 = 
 BodePlot[H[I*2*\[Pi]*freq], {freq, 10^-3, 10^6}, 
  PlotRange -> {{-180, 0}}, PlotLayout -> "Phase", 
  ScalingFunctions -> {"Log10", "Degree"}, 
  FrameLabel -> {HoldForm[Text[Frequency[Hz]]], 
    HoldForm[Text[Phase[Degree]]]}, GridLines -> Automatic, 
  PlotStyle -> Thickness[0.005]]

enter image description here

Result3 = 
 BodePlot[H[I*2*\[Pi]*freq], {freq, 10^-3, 10^6}, 
  PlotRange -> {{-90, 60}, {-180, 0}}, 
  ScalingFunctions -> {{"Log10", "dB"}, {"Log10", "Degree"}}, 
  FrameLabel -> {{HoldForm[Text[Frequency[Hz]]], 
     HoldForm[Text[Magnitude[dB]]]}, {HoldForm[Text[Frequency[Hz]]], 
     HoldForm[Text[Phase[Degree]]]}}, GridLines -> Automatic, 
  PlotStyle -> Thickness[0.005]]

enter image description here

Mathematica 13.2 Notebook file attached.

Thank you.

Attachments:
POSTED BY: Cornel B.
8 Replies
Posted 1 year ago

Eric Rimbey Ok. Thank you. Thanks for the support of the discussion on this topic. If something else will appear, I will post it.

POSTED BY: Cornel B.
Posted 1 year ago

When defining ticks, the form {val, label} gives you the location for the tick as well as the appearance of the tick. The location will be val and the appearance will be label. Superscript is just a form that displays as superscript.

POSTED BY: Eric Rimbey
Posted 1 year ago

Also, what does this code mean:

Superscript[10, i]

it doesn't seem to represent or is equivalent to:

10^i

Does that code Superscript have any equivalent? or what is its equivalent?

Result1 = 
 BodePlot[H[I*2*\[Pi]*freq], {freq, 10^-3, 10^6}, 
  PlotRange -> {{-90, 60}}, PlotLayout -> "Magnitude", 
  ScalingFunctions -> {"Log10", "dB"}, 
  FrameLabel -> {HoldForm[Text[Frequency[Hz]]], 
    HoldForm[Text[Magnitude[dB]]]}, GridLines -> Automatic, 
  PlotStyle -> Thickness[0.005], 
  FrameTicks -> {{Automatic, 
     Automatic}, {Table[{10^i, 10^i}, {i, -3, 6}], None}}]

enter image description here

POSTED BY: Cornel B.
Posted 1 year ago

Mathematica will choose tick labels according to some algorithm that it thinks makes the plot look good. In these cases, it decided that it should only label every other power of 10. But you can choose your own labels. You could add this option to your BodePlot:

FrameTicks -> {{Automatic, Automatic}, {Table[{10^i, Superscript[10, i]}, {i, -3, 5}], None}}
POSTED BY: Eric Rimbey
Posted 1 year ago

Hello Eric Rimbey,

I added. Result:

enter image description here

Mathematica 13.2 Notebook file attached.

Thank you.

Attachments:
POSTED BY: Cornel B.
Posted 1 year ago

It looks like you didn't evaluate the expression defining H.

POSTED BY: Eric Rimbey
Posted 1 year ago

Yes. I evaluate now. Result:

Result1 = 
 BodePlot[H[I*2*\[Pi]*freq], {freq, 10^-3, 10^6}, 
  PlotRange -> {{-90, 60}}, PlotLayout -> "Magnitude", 
  ScalingFunctions -> {"Log10", "dB"}, 
  FrameLabel -> {HoldForm[Text[Frequency[Hz]]], 
    HoldForm[Text[Magnitude[dB]]]}, GridLines -> Automatic, 
  PlotStyle -> Thickness[0.005], 
  FrameTicks -> {{Automatic, 
     Automatic}, {Table[{10^i, Superscript[10, i]}, {i, -3, 5}], 
     None}}]

enter image description here

Result2 = 
 BodePlot[H[I*2*\[Pi]*freq], {freq, 10^-3, 10^6}, 
  PlotRange -> {{-180, 0}}, PlotLayout -> "Phase", 
  ScalingFunctions -> {"Log10", "Degree"}, 
  FrameLabel -> {HoldForm[Text[Frequency[Hz]]], 
    HoldForm[Text[Phase[Degree]]]}, GridLines -> Automatic, 
  PlotStyle -> Thickness[0.005], 
  FrameTicks -> {{Automatic, 
     Automatic}, {Table[{10^i, Superscript[10, i]}, {i, -3, 6}], 
     None}}]

enter image description here

Result3 = 
 BodePlot[H[I*2*\[Pi]*freq], {freq, 10^-3, 10^6}, 
  PlotRange -> {{-90, 60}, {-180, 0}}, 
  ScalingFunctions -> {{"Log10", "dB"}, {"Log10", "Degree"}}, 
  FrameLabel -> {{HoldForm[Text[Frequency[Hz]]], 
     HoldForm[Text[Magnitude[dB]]]}, {HoldForm[Text[Frequency[Hz]]], 
     HoldForm[Text[Phase[Degree]]]}}, GridLines -> Automatic, 
  PlotStyle -> Thickness[0.005], 
  FrameTicks -> {{Automatic, 
     Automatic}, {Table[{10^i, Superscript[10, i]}, {i, -3, 5}], 
     None}}]

enter image description here

Thank you.

Attachments:
POSTED BY: Cornel B.
Posted 1 year ago

Hello Eric Rimbey,

I think I managed to do it for Result3 as well
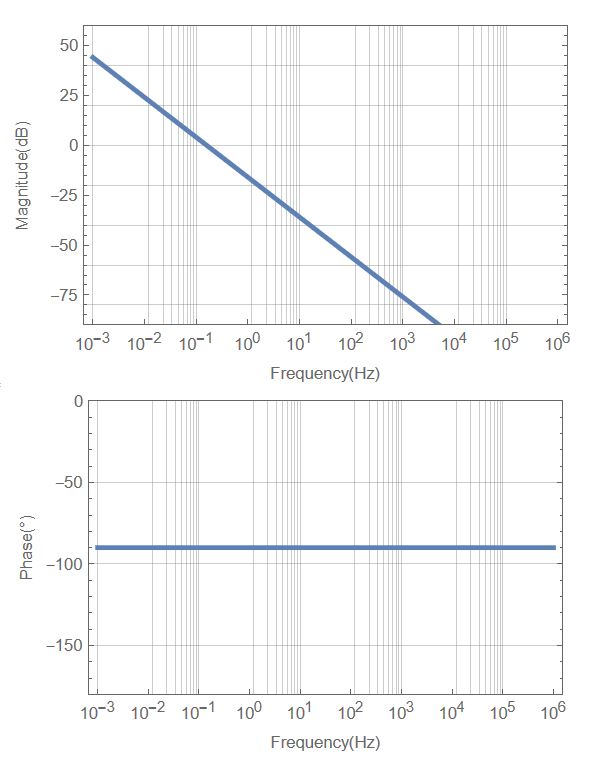
Result3 = 
 BodePlot[H[I*2*\[Pi]*freq], {freq, 10^-3, 10^6}, 
  PlotRange -> {{-90, 60}, {-180, 0}}, 
  ScalingFunctions -> {{"Log10", "dB"}, {"Log10", "Degree"}}, 
  FrameLabel -> {{HoldForm[Text[Frequency[Hz]]], 
     HoldForm[Text[Magnitude[dB]]]}, {HoldForm[Text[Frequency[Hz]]], 
     HoldForm[Text[Phase[Degree]]]}}, GridLines -> Automatic, 
  FrameTicks -> {{{Automatic, 
      Automatic}, {Table[{10^i, Superscript[10, i]}, {i, -3, 6}], 
      None}}, {{Automatic, 
      Automatic}, {Table[{10^i, Superscript[10, i]}, {i, -3, 6}], 
      None}}}, PlotStyle -> Thickness[0.01]]

enter image description here

Now the question is related to that Superscript:
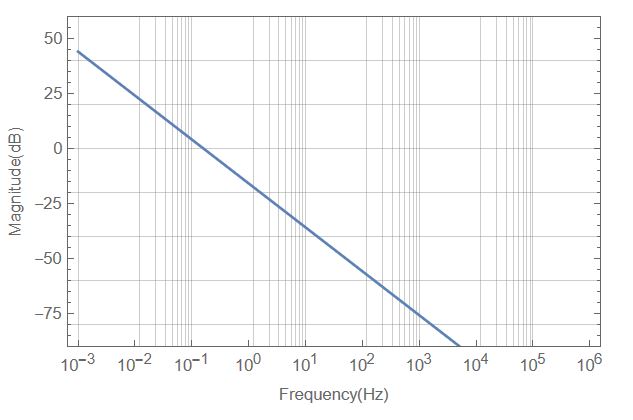
Result1 = 
 BodePlot[H[I*2*\[Pi]*freq], {freq, 10^-3, 10^6}, 
  PlotRange -> {{-90, 60}}, PlotLayout -> "Magnitude", 
  ScalingFunctions -> {"Log10", "dB"}, 
  FrameLabel -> {HoldForm[Text[Frequency[Hz]]], 
    HoldForm[Text[Magnitude[dB]]]}, GridLines -> Automatic, 
  PlotStyle -> Thickness[0.005], 
  FrameTicks -> {{Automatic, 
     Automatic}, {Table[{10^i, Superscript[10, i]}, {i, -3, 6}], 
     None}}]

enter image description here

Result4 = 
 BodePlot[H[I*2*\[Pi]*freq], {freq, 10^-3, 10^6}, 
  PlotRange -> {{-90, 60}}, PlotLayout -> "Magnitude", 
  ScalingFunctions -> {"Log10", "dB"}, 
  FrameLabel -> {HoldForm[Text[Frequency[Hz]]], 
    HoldForm[Text[Magnitude[dB]]]}, GridLines -> Automatic, 
  PlotStyle -> Thickness[0.005], 
  FrameTicks -> {{Automatic, 
     Automatic}, {Table[{10^i, 10^i}, {i, -3, 6}], None}}]

enter image description here

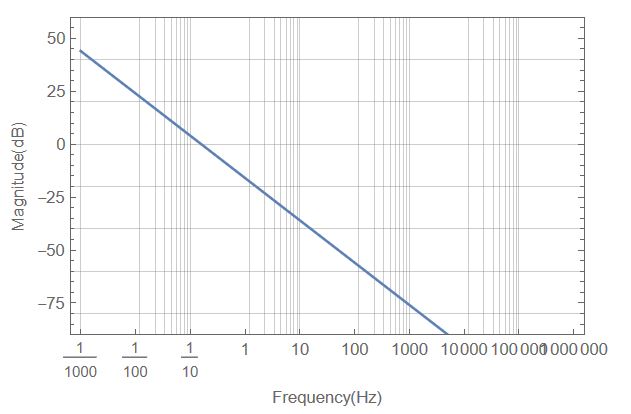
The only difference between Result1 and Result4 is only there in Table[...] Looks like Superscript[10, i] wouldn't equal 10^i...? Although it seems that the 2 should have been equal, at least that's what the documentation shows: https://reference.wolfram.com/language/ref/Superscript.html

Mathematica 13.2 Notebook fille attached.

Thank you.

Attachments:
POSTED BY: Cornel B.
Reply to this discussion
Community posts can be styled and formatted using the Markdown syntax.
Reply Preview
Attachments
Remove
or Discard

Group Abstract Group Abstract