Hello,
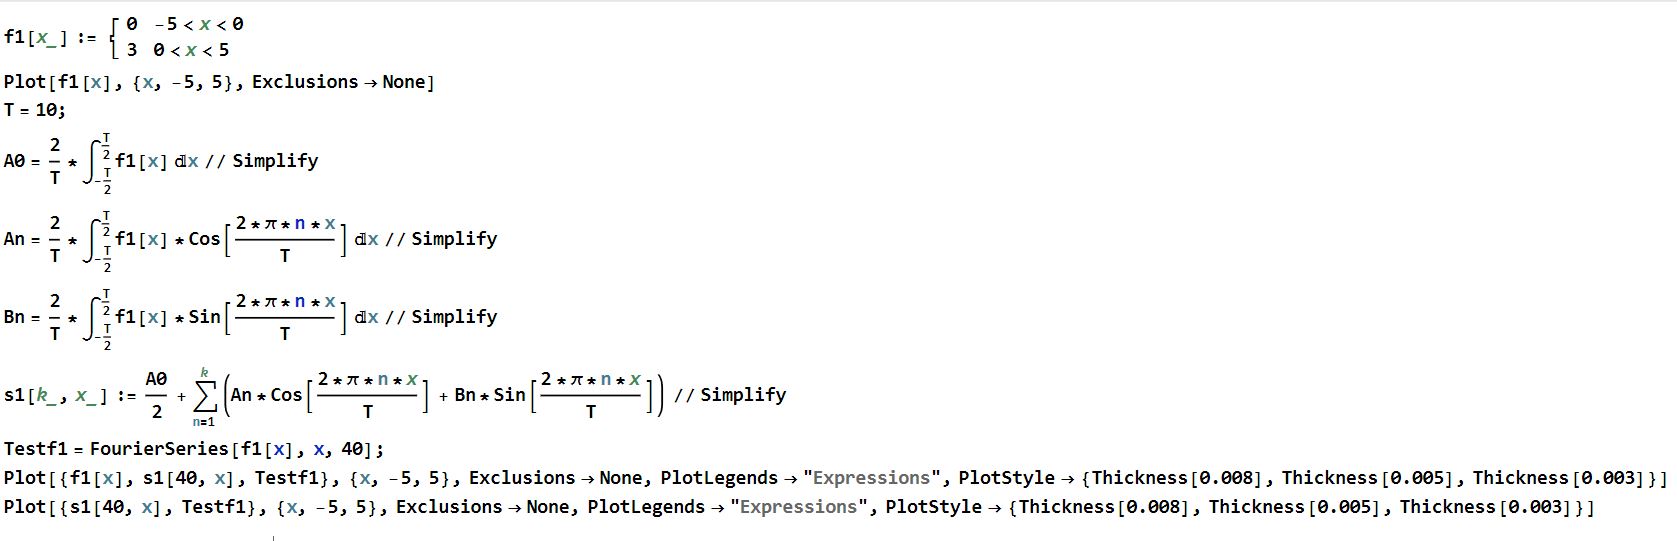
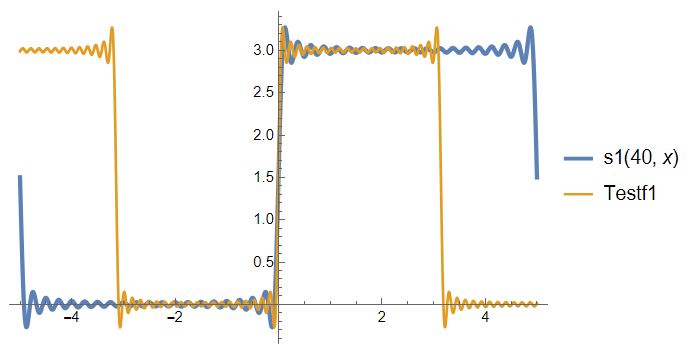
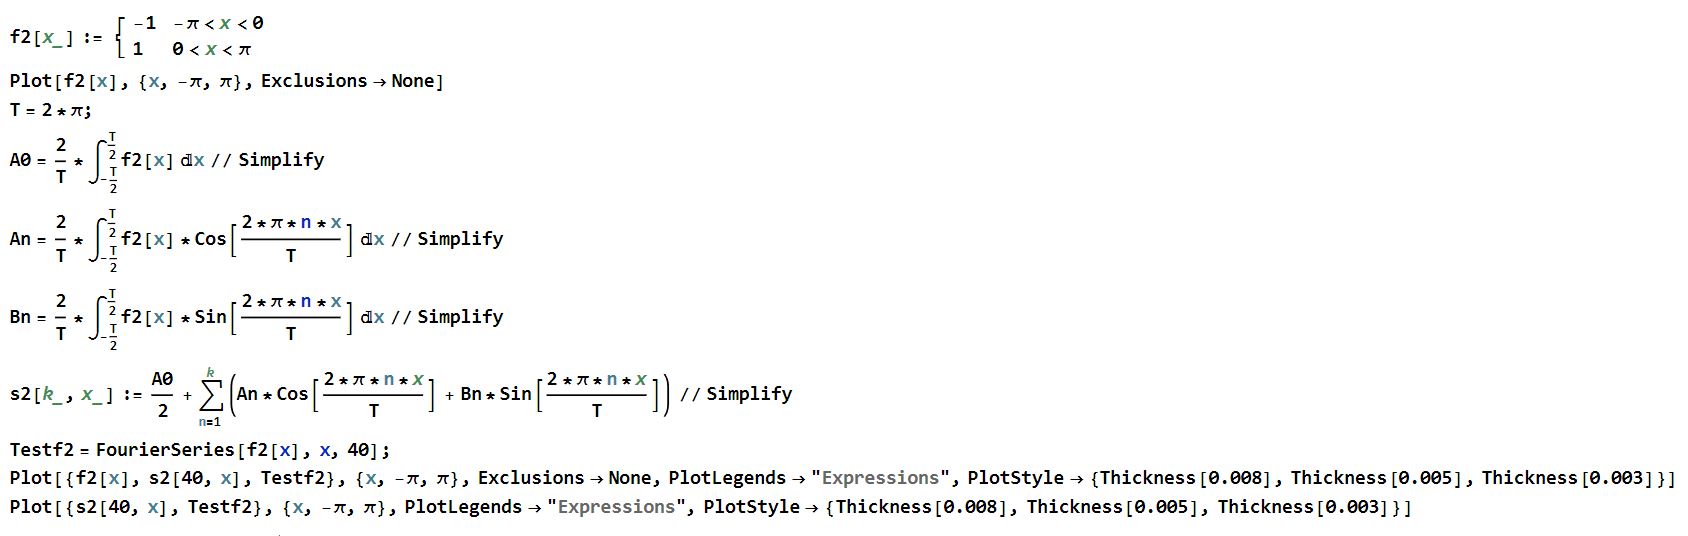
Why for the function f1 the Fourier series calculated by Mathematica does not give the same graph as the Fourier series calculated with the sum of sin and cos (https://en.wikipedia.org/wiki/Fourier_series)?
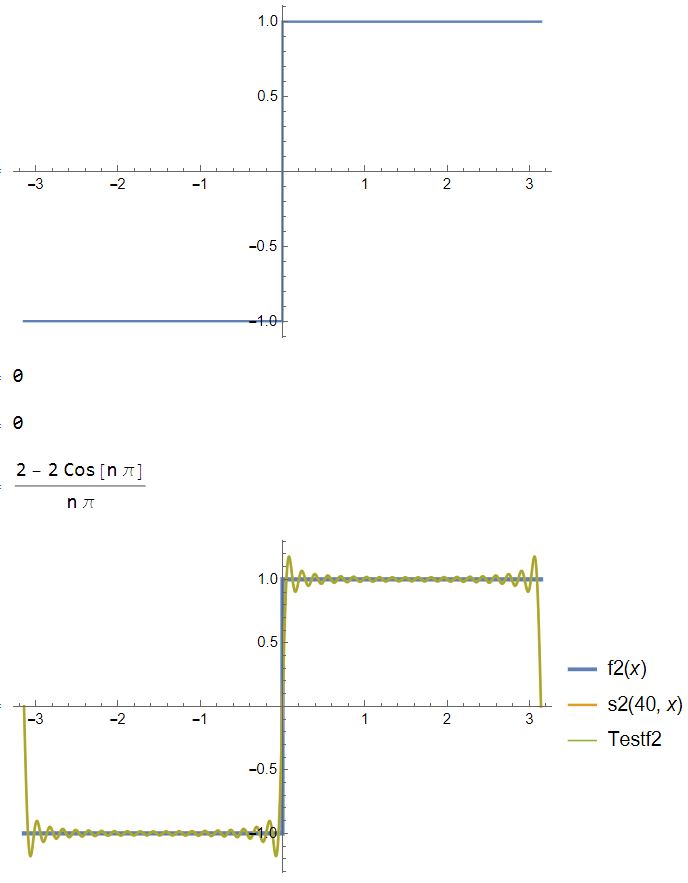
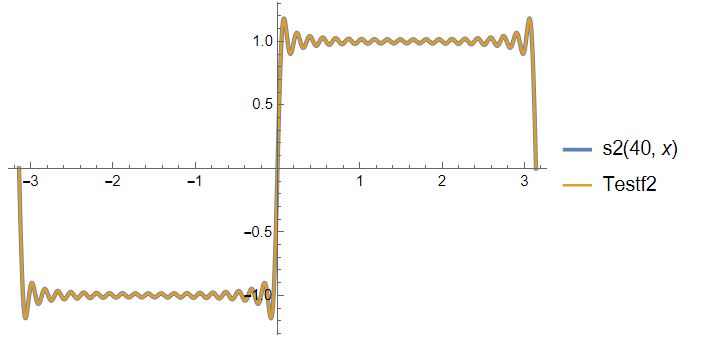
In the case of function f2, we can see that the two calculation methods give the same results. I don't understand why in the case of function f1 the two methods do not give the same results.
I saw that Mathematica gives the Fourier series in the exponential form, but the exponential form and the sine and cos form should give the same results, right?
f1[x_] := \!\(\*
TagBox[GridBox[{
{"\[Piecewise]", GridBox[{
{"0",
RowBox[{
RowBox[{"-", "5"}], "<", "x", "<", "0"}]},
{"3",
RowBox[{"0", "<", "x", "<", "5"}]}
},
AllowedDimensions->{2, Automatic},
Editable->True,
GridBoxAlignment->{"Columns" -> {{Left}}, "Rows" -> {{Baseline}}},
GridBoxItemSize->{"Columns" -> {{Automatic}}, "Rows" -> {{1.}}},
GridBoxSpacings->{"Columns" -> {
Offset[0.27999999999999997`], {
Offset[0.84]},
Offset[0.27999999999999997`]}, "Rows" -> {
Offset[0.2], {
Offset[0.4]},
Offset[0.2]}},
Selectable->True]}
},
GridBoxAlignment->{"Columns" -> {{Left}}, "Rows" -> {{Baseline}}},
GridBoxItemSize->{"Columns" -> {{Automatic}}, "Rows" -> {{1.}}},
GridBoxSpacings->{"Columns" -> {
Offset[0.27999999999999997`], {
Offset[0.35]},
Offset[0.27999999999999997`]}, "Rows" -> {
Offset[0.2], {
Offset[0.4]},
Offset[0.2]}}],
"Piecewise",
DeleteWithContents->True,
Editable->False,
SelectWithContents->True,
Selectable->False,
StripWrapperBoxes->True]\)
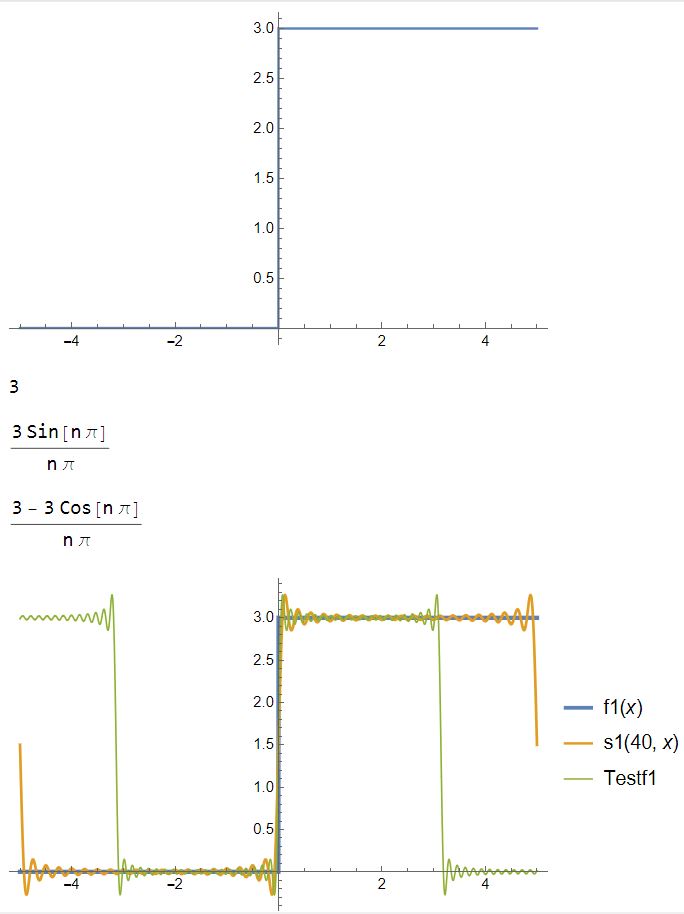
Plot[f1[x], {x, -5, 5}, Exclusions -> None]
T = 10;
A0 = 2/T*\!\(
\*SubsuperscriptBox[\(\[Integral]\), \(-
\*FractionBox[\(T\), \(2\)]\),
FractionBox[\(T\), \(2\)]]\(f1[x] \[DifferentialD]x\)\) // Simplify
An = 2/T*\!\(
\*SubsuperscriptBox[\(\[Integral]\), \(-
\*FractionBox[\(T\), \(2\)]\),
FractionBox[\(T\), \(2\)]]\(f1[x]*Cos[
\*FractionBox[\(2*\[Pi]*n*x\), \(T\)]] \[DifferentialD]x\)\) //
Simplify
Bn = 2/T*\!\(
\*SubsuperscriptBox[\(\[Integral]\), \(-
\*FractionBox[\(T\), \(2\)]\),
FractionBox[\(T\), \(2\)]]\(f1[x]*Sin[
\*FractionBox[\(2*\[Pi]*n*x\), \(T\)]] \[DifferentialD]x\)\) //
Simplify
s1[k_, x_] := A0/2 + \!\(
\*UnderoverscriptBox[\(\[Sum]\), \(n = 1\), \(k\)]\((An*Cos[
\*FractionBox[\(2*\[Pi]*n*x\), \(T\)]] + Bn*Sin[
\*FractionBox[\(2*\[Pi]*n*x\), \(T\)]])\)\) // Simplify
Testf1 = FourierSeries[f1[x], x, 40];
Plot[{f1[x], s1[40, x], Testf1}, {x, -5, 5}, Exclusions -> None,
PlotLegends -> "Expressions",
PlotStyle -> {Thickness[0.008], Thickness[0.005], Thickness[0.003]}]
Plot[{s1[40, x], Testf1}, {x, -5, 5}, Exclusions -> None,
PlotLegends -> "Expressions",
PlotStyle -> {Thickness[0.008], Thickness[0.005], Thickness[0.003]}]
f2[x_] := \!\(\*
TagBox[GridBox[{
{"\[Piecewise]", GridBox[{
{
RowBox[{"-", "1"}],
RowBox[{
RowBox[{"-", "\[Pi]"}], "<", "x", "<", "0"}]},
{"1",
RowBox[{"0", "<", "x", "<", "\[Pi]"}]}
},
AllowedDimensions->{2, Automatic},
Editable->True,
GridBoxAlignment->{"Columns" -> {{Left}}, "Rows" -> {{Baseline}}},
GridBoxItemSize->{"Columns" -> {{Automatic}}, "Rows" -> {{1.}}},
GridBoxSpacings->{"Columns" -> {
Offset[0.27999999999999997`], {
Offset[0.84]},
Offset[0.27999999999999997`]}, "Rows" -> {
Offset[0.2], {
Offset[0.4]},
Offset[0.2]}},
Selectable->True]}
},
GridBoxAlignment->{"Columns" -> {{Left}}, "Rows" -> {{Baseline}}},
GridBoxItemSize->{"Columns" -> {{Automatic}}, "Rows" -> {{1.}}},
GridBoxSpacings->{"Columns" -> {
Offset[0.27999999999999997`], {
Offset[0.35]},
Offset[0.27999999999999997`]}, "Rows" -> {
Offset[0.2], {
Offset[0.4]},
Offset[0.2]}}],
"Piecewise",
DeleteWithContents->True,
Editable->False,
SelectWithContents->True,
Selectable->False,
StripWrapperBoxes->True]\)
Plot[f2[x], {x, -\[Pi], \[Pi]}, Exclusions -> None]
T = 2*\[Pi];
A0 = 2/T*\!\(
\*SubsuperscriptBox[\(\[Integral]\), \(-
\*FractionBox[\(T\), \(2\)]\),
FractionBox[\(T\), \(2\)]]\(f2[x] \[DifferentialD]x\)\) // Simplify
An = 2/T*\!\(
\*SubsuperscriptBox[\(\[Integral]\), \(-
\*FractionBox[\(T\), \(2\)]\),
FractionBox[\(T\), \(2\)]]\(f2[x]*Cos[
\*FractionBox[\(2*\[Pi]*n*x\), \(T\)]] \[DifferentialD]x\)\) //
  Simplify
Bn = 2/T*\!\(
\*SubsuperscriptBox[\(\[Integral]\), \(-
\*FractionBox[\(T\), \(2\)]\),
FractionBox[\(T\), \(2\)]]\(f2[x]*Sin[
\*FractionBox[\(2*\[Pi]*n*x\), \(T\)]] \[DifferentialD]x\)\) //
  Simplify
s2[k_, x_] := A0/2 + \!\(
\*UnderoverscriptBox[\(\[Sum]\), \(n = 1\), \(k\)]\((An*Cos[
\*FractionBox[\(2*\[Pi]*n*x\), \(T\)]] + Bn*Sin[
\*FractionBox[\(2*\[Pi]*n*x\), \(T\)]])\)\) // Simplify
Testf2 = FourierSeries[f2[x], x, 40];
Plot[{f2[x], s2[40, x], Testf2}, {x, -\[Pi], \[Pi]},
 Exclusions -> None, PlotLegends -> "Expressions",
 PlotStyle -> {Thickness[0.008], Thickness[0.005], Thickness[0.003]}]
Plot[{s2[40, x], Testf2}, {x, -\[Pi], \[Pi]},
 PlotLegends -> "Expressions",
 PlotStyle -> {Thickness[0.008], Thickness[0.005], Thickness[0.003]}]
Mathematica 13.2 Notebook file attached.
Thank you.
 Attachments:


