Message Boards Message Boards

Fourier Series calculated by Mathematica gives wrong result?

Posted 1 year ago

Hello,

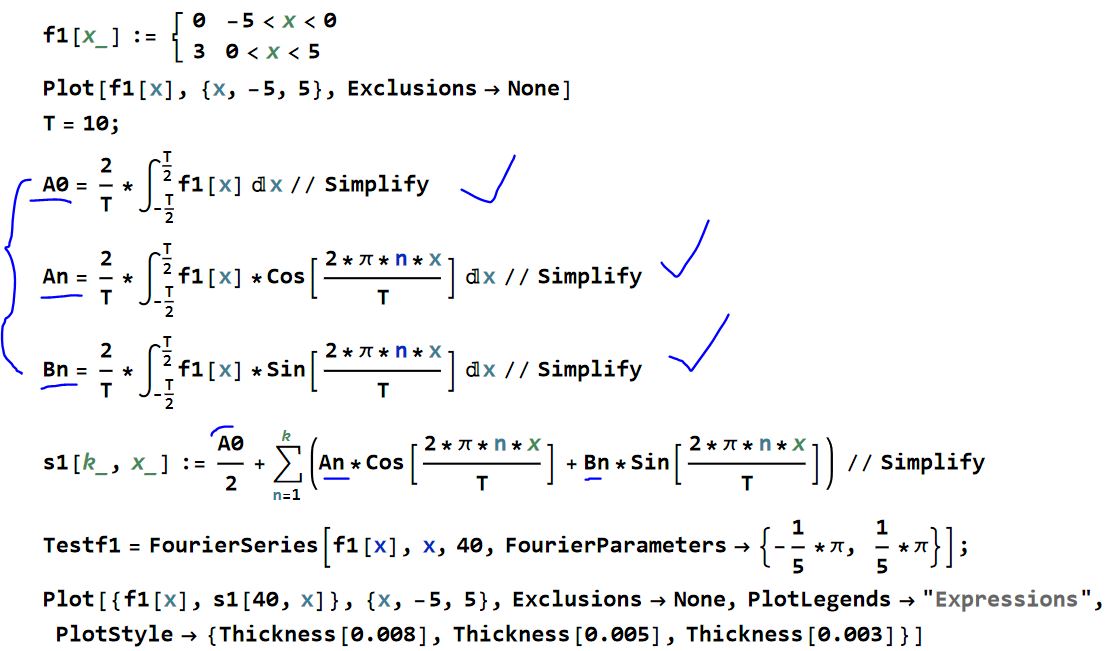
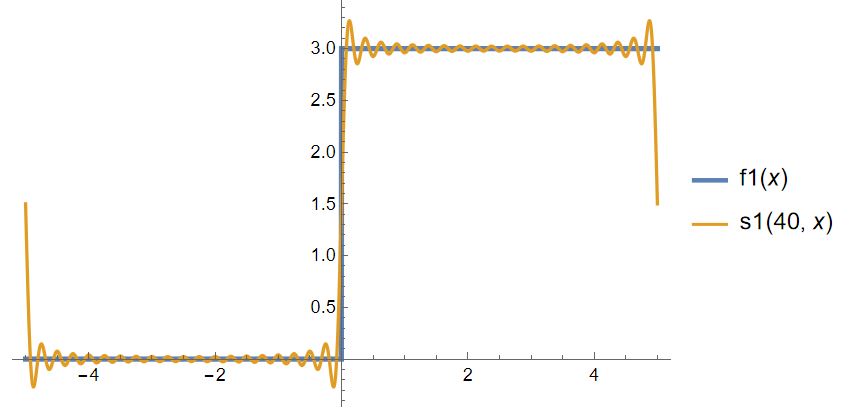
Why for the function f1 the Fourier series calculated by Mathematica does not give the same graph as the Fourier series calculated with the sum of sin and cos (https://en.wikipedia.org/wiki/Fourier_series)?

In the case of function f2, we can see that the two calculation methods give the same results. I don't understand why in the case of function f1 the two methods do not give the same results.

I saw that Mathematica gives the Fourier series in the exponential form, but the exponential form and the sine and cos form should give the same results, right?

f1[x_] := \!\(\*
TagBox[GridBox[{
{"\[Piecewise]", GridBox[{
{"0", 
RowBox[{
RowBox[{"-", "5"}], "<", "x", "<", "0"}]},
{"3", 
RowBox[{"0", "<", "x", "<", "5"}]}
},
AllowedDimensions->{2, Automatic},
Editable->True,
GridBoxAlignment->{"Columns" -> {{Left}}, "Rows" -> {{Baseline}}},
GridBoxItemSize->{"Columns" -> {{Automatic}}, "Rows" -> {{1.}}},
GridBoxSpacings->{"Columns" -> {
Offset[0.27999999999999997`], {
Offset[0.84]}, 
Offset[0.27999999999999997`]}, "Rows" -> {
Offset[0.2], {
Offset[0.4]}, 
Offset[0.2]}},
Selectable->True]}
},
GridBoxAlignment->{"Columns" -> {{Left}}, "Rows" -> {{Baseline}}},
GridBoxItemSize->{"Columns" -> {{Automatic}}, "Rows" -> {{1.}}},
GridBoxSpacings->{"Columns" -> {
Offset[0.27999999999999997`], {
Offset[0.35]}, 
Offset[0.27999999999999997`]}, "Rows" -> {
Offset[0.2], {
Offset[0.4]}, 
Offset[0.2]}}],
"Piecewise",
DeleteWithContents->True,
Editable->False,
SelectWithContents->True,
Selectable->False,
StripWrapperBoxes->True]\)
Plot[f1[x], {x, -5, 5}, Exclusions -> None]
T = 10;
A0 = 2/T*\!\(
\*SubsuperscriptBox[\(\[Integral]\), \(-
\*FractionBox[\(T\), \(2\)]\), 
FractionBox[\(T\), \(2\)]]\(f1[x] \[DifferentialD]x\)\) // Simplify
An = 2/T*\!\(
\*SubsuperscriptBox[\(\[Integral]\), \(-
\*FractionBox[\(T\), \(2\)]\), 
FractionBox[\(T\), \(2\)]]\(f1[x]*Cos[
\*FractionBox[\(2*\[Pi]*n*x\), \(T\)]] \[DifferentialD]x\)\) // 
  Simplify
Bn = 2/T*\!\(
\*SubsuperscriptBox[\(\[Integral]\), \(-
\*FractionBox[\(T\), \(2\)]\), 
FractionBox[\(T\), \(2\)]]\(f1[x]*Sin[
\*FractionBox[\(2*\[Pi]*n*x\), \(T\)]] \[DifferentialD]x\)\) // 
  Simplify
s1[k_, x_] := A0/2 + \!\(
\*UnderoverscriptBox[\(\[Sum]\), \(n = 1\), \(k\)]\((An*Cos[
\*FractionBox[\(2*\[Pi]*n*x\), \(T\)]] + Bn*Sin[
\*FractionBox[\(2*\[Pi]*n*x\), \(T\)]])\)\) // Simplify
Testf1 = FourierSeries[f1[x], x, 40];
Plot[{f1[x], s1[40, x], Testf1}, {x, -5, 5}, Exclusions -> None, 
 PlotLegends -> "Expressions", 
 PlotStyle -> {Thickness[0.008], Thickness[0.005], Thickness[0.003]}]
Plot[{s1[40, x], Testf1}, {x, -5, 5}, Exclusions -> None, 
 PlotLegends -> "Expressions", 
 PlotStyle -> {Thickness[0.008], Thickness[0.005], Thickness[0.003]}]

enter image description here

enter image description here

enter image description here

f2[x_] := \!\(\*
TagBox[GridBox[{
{"\[Piecewise]", GridBox[{
{
RowBox[{"-", "1"}], 
RowBox[{
RowBox[{"-", "\[Pi]"}], "<", "x", "<", "0"}]},
{"1", 
RowBox[{"0", "<", "x", "<", "\[Pi]"}]}
},
AllowedDimensions->{2, Automatic},
Editable->True,
GridBoxAlignment->{"Columns" -> {{Left}}, "Rows" -> {{Baseline}}},
GridBoxItemSize->{"Columns" -> {{Automatic}}, "Rows" -> {{1.}}},
GridBoxSpacings->{"Columns" -> {
Offset[0.27999999999999997`], {
Offset[0.84]}, 
Offset[0.27999999999999997`]}, "Rows" -> {
Offset[0.2], {
Offset[0.4]}, 
Offset[0.2]}},
Selectable->True]}
},
GridBoxAlignment->{"Columns" -> {{Left}}, "Rows" -> {{Baseline}}},
GridBoxItemSize->{"Columns" -> {{Automatic}}, "Rows" -> {{1.}}},
GridBoxSpacings->{"Columns" -> {
Offset[0.27999999999999997`], {
Offset[0.35]}, 
Offset[0.27999999999999997`]}, "Rows" -> {
Offset[0.2], {
Offset[0.4]}, 
Offset[0.2]}}],
"Piecewise",
DeleteWithContents->True,
Editable->False,
SelectWithContents->True,
Selectable->False,
StripWrapperBoxes->True]\)
Plot[f2[x], {x, -\[Pi], \[Pi]}, Exclusions -> None]
T = 2*\[Pi];
A0 = 2/T*\!\(
\*SubsuperscriptBox[\(\[Integral]\), \(-
\*FractionBox[\(T\), \(2\)]\), 
FractionBox[\(T\), \(2\)]]\(f2[x] \[DifferentialD]x\)\) // Simplify
An = 2/T*\!\(
\*SubsuperscriptBox[\(\[Integral]\), \(-
\*FractionBox[\(T\), \(2\)]\), 
FractionBox[\(T\), \(2\)]]\(f2[x]*Cos[
\*FractionBox[\(2*\[Pi]*n*x\), \(T\)]] \[DifferentialD]x\)\) // 
  Simplify
Bn = 2/T*\!\(
\*SubsuperscriptBox[\(\[Integral]\), \(-
\*FractionBox[\(T\), \(2\)]\), 
FractionBox[\(T\), \(2\)]]\(f2[x]*Sin[
\*FractionBox[\(2*\[Pi]*n*x\), \(T\)]] \[DifferentialD]x\)\) // 
  Simplify
s2[k_, x_] := A0/2 + \!\(
\*UnderoverscriptBox[\(\[Sum]\), \(n = 1\), \(k\)]\((An*Cos[
\*FractionBox[\(2*\[Pi]*n*x\), \(T\)]] + Bn*Sin[
\*FractionBox[\(2*\[Pi]*n*x\), \(T\)]])\)\) // Simplify
Testf2 = FourierSeries[f2[x], x, 40];
Plot[{f2[x], s2[40, x], Testf2}, {x, -\[Pi], \[Pi]}, 
 Exclusions -> None, PlotLegends -> "Expressions", 
 PlotStyle -> {Thickness[0.008], Thickness[0.005], Thickness[0.003]}]
Plot[{s2[40, x], Testf2}, {x, -\[Pi], \[Pi]}, 
 PlotLegends -> "Expressions", 
 PlotStyle -> {Thickness[0.008], Thickness[0.005], Thickness[0.003]}]

enter image description here

enter image description here

enter image description here

Mathematica 13.2 Notebook file attached.

Thank you.

Attachments:
POSTED BY: Cornel B.
6 Replies

The function FourierSeries assumes by default that the interval is between -Pi and Pi. For other intervals you have to use the option FourierParameters.

POSTED BY: Gianluca Gorni
Posted 1 year ago

Ok. Thank you.

Testf1 = 
  FourierSeries[f1[x], x, 40, 
   FourierParameters -> {-(1/5)*\[Pi], 1/5*\[Pi]}];

enter image description here

enter image description here

enter image description here

POSTED BY: Cornel B.
Posted 1 year ago

Another thing:

enter image description here

enter image description here

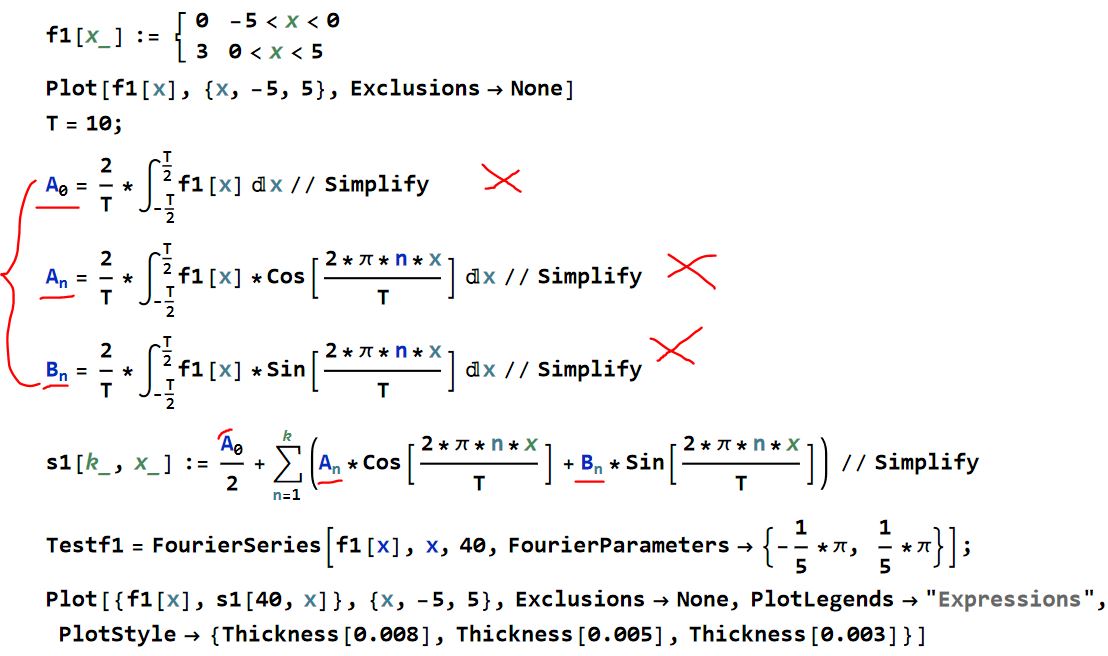
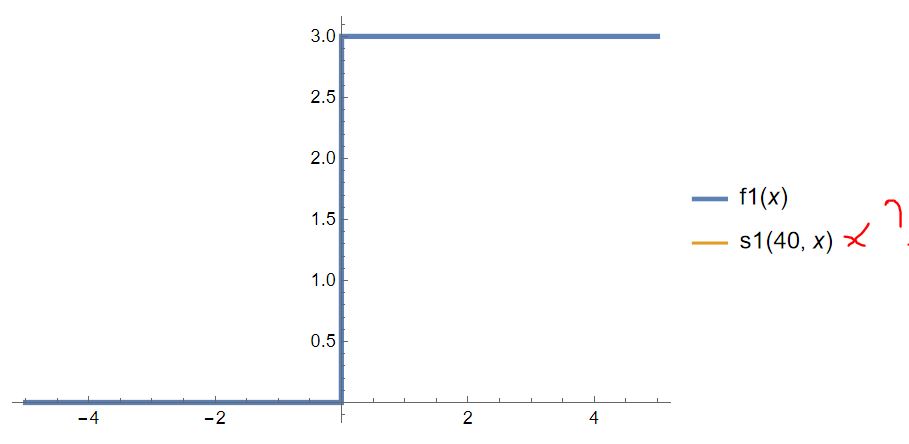
When I use subscripts for 0 and n at A0, An, and Bn then it doesn't calculate... how can I use subscripts at A0, An, and Bn? Is such a thing possible?
enter image description here

enter image description here

In principle, I think I found out why those sums are not calculated when I use subscripts at those variables. For example:
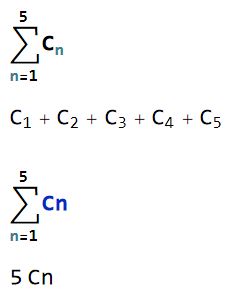
enter image description here

But I'm interested if there is any way to use subscripts for those sums...?

f1[x_] := \!\(\*
TagBox[GridBox[{
{"\[Piecewise]", GridBox[{
{"0", 
RowBox[{
RowBox[{"-", "5"}], "<", "x", "<", "0"}]},
{"3", 
RowBox[{"0", "<", "x", "<", "5"}]}
},
AllowedDimensions->{2, Automatic},
Editable->True,
GridBoxAlignment->{"Columns" -> {{Left}}, "Rows" -> {{Baseline}}},
GridBoxItemSize->{"Columns" -> {{Automatic}}, "Rows" -> {{1.}}},
GridBoxSpacings->{"Columns" -> {
Offset[0.27999999999999997`], {
Offset[0.84]}, 
Offset[0.27999999999999997`]}, "Rows" -> {
Offset[0.2], {
Offset[0.4]}, 
Offset[0.2]}},
Selectable->True]}
},
GridBoxAlignment->{"Columns" -> {{Left}}, "Rows" -> {{Baseline}}},
GridBoxItemSize->{"Columns" -> {{Automatic}}, "Rows" -> {{1.}}},
GridBoxSpacings->{"Columns" -> {
Offset[0.27999999999999997`], {
Offset[0.35]}, 
Offset[0.27999999999999997`]}, "Rows" -> {
Offset[0.2], {
Offset[0.4]}, 
Offset[0.2]}}],
"Piecewise",
DeleteWithContents->True,
Editable->False,
SelectWithContents->True,
Selectable->False,
StripWrapperBoxes->True]\)
Plot[f1[x], {x, -5, 5}, Exclusions -> None]
T = 10;
Subscript[A, 0] = 2/T*\!\(
\*SubsuperscriptBox[\(\[Integral]\), \(-
\*FractionBox[\(T\), \(2\)]\), 
FractionBox[\(T\), \(2\)]]\(f1[x] \[DifferentialD]x\)\) // Simplify
Subscript[A, n] = 2/T*\!\(
\*SubsuperscriptBox[\(\[Integral]\), \(-
\*FractionBox[\(T\), \(2\)]\), 
FractionBox[\(T\), \(2\)]]\(f1[x]*Cos[
\*FractionBox[\(2*\[Pi]*n*x\), \(T\)]] \[DifferentialD]x\)\) // 
  Simplify
Subscript[B, n] = 2/T*\!\(
\*SubsuperscriptBox[\(\[Integral]\), \(-
\*FractionBox[\(T\), \(2\)]\), 
FractionBox[\(T\), \(2\)]]\(f1[x]*Sin[
\*FractionBox[\(2*\[Pi]*n*x\), \(T\)]] \[DifferentialD]x\)\) // 
  Simplify
s1[k_, x_] := Subscript[A, 0]/2 + \!\(
\*UnderoverscriptBox[\(\[Sum]\), \(n = 1\), \(k\)]\((
\*SubscriptBox[\(A\), \(n\)]*Cos[
\*FractionBox[\(2*\[Pi]*n*x\), \(T\)]] + 
\*SubscriptBox[\(B\), \(n\)]*Sin[
\*FractionBox[\(2*\[Pi]*n*x\), \(T\)]])\)\) // Simplify
Testf1 = 
  FourierSeries[f1[x], x, 40, 
   FourierParameters -> {-(1/5)*\[Pi], 1/5*\[Pi]}];
Plot[{f1[x], s1[40, x]}, {x, -5, 5}, Exclusions -> None, 
 PlotLegends -> "Expressions", 
 PlotStyle -> {Thickness[0.008], Thickness[0.005], Thickness[0.003]}]
Attachments:
POSTED BY: Cornel B.

You have to use patterns: Subscript[A, n_] =, just as in function definitions.

POSTED BY: Gianluca Gorni
Posted 1 year ago

Can you write an example for this line of code?

Subscript[A, n] = 2/T*\!\(
\*SubsuperscriptBox[\(\[Integral]\), \(-
\*FractionBox[\(T\), \(2\)]\), 
FractionBox[\(T\), \(2\)]]\(f1[x]*Cos[
\*FractionBox[\(2*\[Pi]*n*x\), \(T\)]] \[DifferentialD]x\)\)

enter image description here

Do you mean something like this?

enter image description here

POSTED BY: Cornel B.

The pattern, that is, the underscore:

Subscript[A, n_] = 
 2/T Integrate[Exp[x] Cos[2 Pi n x/T], {x, -T/2, T/2}]
Sum[Subscript[A, n], {n, 0, 5}]

Without the underscore, the definition is used only with literal n.

POSTED BY: Gianluca Gorni
Reply to this discussion
Community posts can be styled and formatted using the Markdown syntax.
Reply Preview
Attachments
Remove
or Discard

Group Abstract Group Abstract