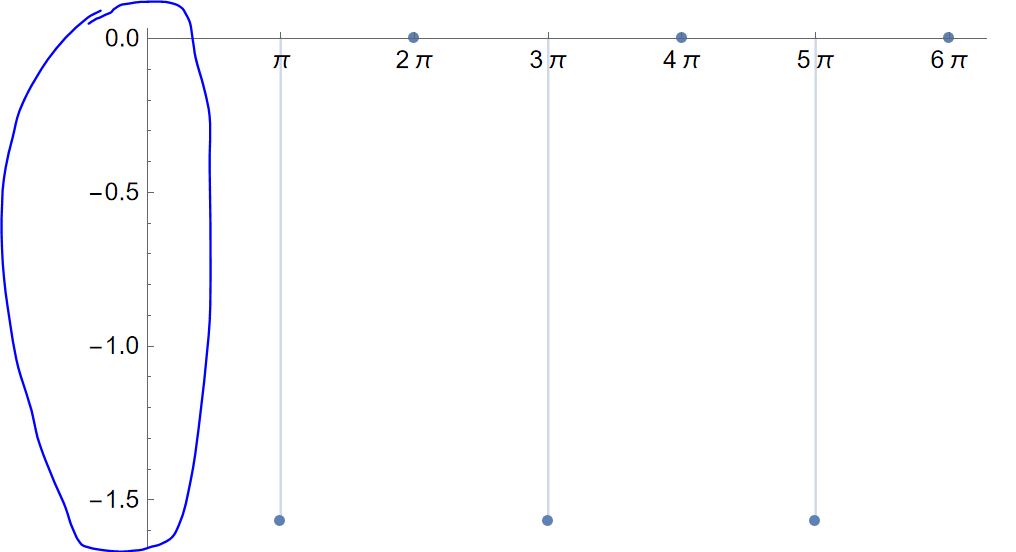
Now if I want to have on the y-axis something like that:
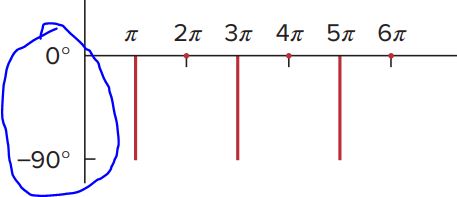
How can I do this?
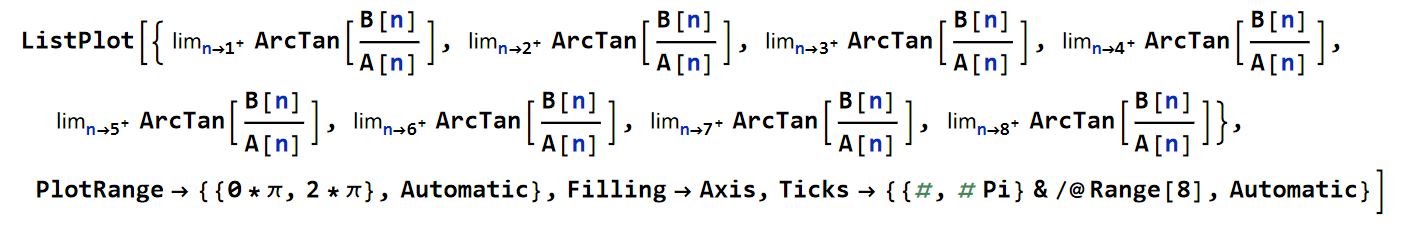
ListPlot[{\!\(
\*SubscriptBox[\(\[Limit]\), \(n ->
\*SuperscriptBox[\(1\), \(+\)]\)]\(ArcTan[
\*FractionBox[\(B[n]\), \(A[n]\)]]\)\), \!\(
\*SubscriptBox[\(\[Limit]\), \(n ->
\*SuperscriptBox[\(2\), \(+\)]\)]\(ArcTan[
\*FractionBox[\(B[n]\), \(A[n]\)]]\)\), \!\(
\*SubscriptBox[\(\[Limit]\), \(n ->
\*SuperscriptBox[\(3\), \(+\)]\)]\(ArcTan[
\*FractionBox[\(B[n]\), \(A[n]\)]]\)\), \!\(
\*SubscriptBox[\(\[Limit]\), \(n ->
\*SuperscriptBox[\(4\), \(+\)]\)]\(ArcTan[
\*FractionBox[\(B[n]\), \(A[n]\)]]\)\), \!\(
\*SubscriptBox[\(\[Limit]\), \(n ->
\*SuperscriptBox[\(5\), \(+\)]\)]\(ArcTan[
\*FractionBox[\(B[n]\), \(A[n]\)]]\)\), \!\(
\*SubscriptBox[\(\[Limit]\), \(n ->
\*SuperscriptBox[\(6\), \(+\)]\)]\(ArcTan[
\*FractionBox[\(B[n]\), \(A[n]\)]]\)\), \!\(
\*SubscriptBox[\(\[Limit]\), \(n ->
\*SuperscriptBox[\(7\), \(+\)]\)]\(ArcTan[
\*FractionBox[\(B[n]\), \(A[n]\)]]\)\), \!\(
\*SubscriptBox[\(\[Limit]\), \(n ->
\*SuperscriptBox[\(8\), \(+\)]\)]\(ArcTan[
\*FractionBox[\(B[n]\), \(A[n]\)]]\)\)},
 PlotRange -> {{0*\[Pi], 2*\[Pi]}, Automatic}, Filling -> Axis,
 Ticks -> {{#, # Pi} & /@ Range[8], Automatic}]
Mathematica 13.2 Notebook file attached.
Entire Code:
f5[x_] := \!\(\*
TagBox[GridBox[{
{"\[Piecewise]", GridBox[{
{"1",
RowBox[{"0", "<", "x", "<", "1"}]},
{"0",
RowBox[{"1", "<", "x", "<", "2"}]}
},
AllowedDimensions->{2, Automatic},
Editable->True,
GridBoxAlignment->{"Columns" -> {{Left}}, "Rows" -> {{Baseline}}},
GridBoxItemSize->{"Columns" -> {{Automatic}}, "Rows" -> {{1.}}},
GridBoxSpacings->{"Columns" -> {
Offset[0.27999999999999997`], {
Offset[0.84]},
Offset[0.27999999999999997`]}, "Rows" -> {
Offset[0.2], {
Offset[0.4]},
Offset[0.2]}},
Selectable->True]}
},
GridBoxAlignment->{"Columns" -> {{Left}}, "Rows" -> {{Baseline}}},
GridBoxItemSize->{"Columns" -> {{Automatic}}, "Rows" -> {{1.}}},
GridBoxSpacings->{"Columns" -> {
Offset[0.27999999999999997`], {
Offset[0.35]},
Offset[0.27999999999999997`]}, "Rows" -> {
Offset[0.2], {
Offset[0.4]},
Offset[0.2]}}],
"Piecewise",
DeleteWithContents->True,
Editable->False,
SelectWithContents->True,
Selectable->False,
StripWrapperBoxes->True]\)
Plot[f5[x], {x, 0, 2.5}, Exclusions -> None];
T = 2 - 0;
A0 = 2/T*\!\(
\*SubsuperscriptBox[\(\[Integral]\), \(-
\*FractionBox[\(T\), \(2\)]\),
FractionBox[\(T\), \(2\)]]\(f5[x] \[DifferentialD]x\)\) // Simplify;
A[n_] = 2/T*\!\(
\*SubsuperscriptBox[\(\[Integral]\), \(-
\*FractionBox[\(T\), \(2\)]\),
FractionBox[\(T\), \(2\)]]\(f5[x]*Cos[
\*FractionBox[\(2*\[Pi]*n*x\), \(T\)]] \[DifferentialD]x\)\) //
   Simplify;
B[n_] = 2/T*\!\(
\*SubsuperscriptBox[\(\[Integral]\), \(-
\*FractionBox[\(T\), \(2\)]\),
FractionBox[\(T\), \(2\)]]\(f5[x]*Sin[
\*FractionBox[\(2*\[Pi]*n*x\), \(T\)]] \[DifferentialD]x\)\) //
   Simplify;
s5[k_, x_] := A0/2 + \!\(
\*UnderoverscriptBox[\(\[Sum]\), \(n = 1\), \(k\)]\((A[n]*Cos[
\*FractionBox[\(2*\[Pi]*n*x\), \(T\)]] + B[n]*Sin[
\*FractionBox[\(2*\[Pi]*n*x\), \(T\)]])\)\) // Simplify;

Plot[{f5[x], s5[11, x]}, {x, 0, 2}, Exclusions -> None,
 PlotLegends -> "Expressions",
 PlotStyle -> {Thickness[0.008], Thickness[0.005]}]

Show[ListPlot[Sqrt[A[n]^2 + B[n]^2] /. n -> {1, 2, 3, 4, 5, 6, 7, 8},
  PlotRange -> {{0*\[Pi], 2*\[Pi]}, Automatic}, Filling -> Axis,
  Ticks -> {{#, # Pi} & /@ Range[8], Automatic}],
 Plot[{Sqrt[A[1]^2 + B[1]^2], Sqrt[A[3]^2 + B[3]^2]}, {\[Omega], 0,
   6*\[Pi]}]]

ListPlot[{\!\(
\*SubscriptBox[\(\[Limit]\), \(n ->
\*SuperscriptBox[\(1\), \(+\)]\)]\(ArcTan[
\*FractionBox[\(B[n]\), \(A[n]\)]]\)\), \!\(
\*SubscriptBox[\(\[Limit]\), \(n ->
\*SuperscriptBox[\(2\), \(+\)]\)]\(ArcTan[
\*FractionBox[\(B[n]\), \(A[n]\)]]\)\), \!\(
\*SubscriptBox[\(\[Limit]\), \(n ->
\*SuperscriptBox[\(3\), \(+\)]\)]\(ArcTan[
\*FractionBox[\(B[n]\), \(A[n]\)]]\)\), \!\(
\*SubscriptBox[\(\[Limit]\), \(n ->
\*SuperscriptBox[\(4\), \(+\)]\)]\(ArcTan[
\*FractionBox[\(B[n]\), \(A[n]\)]]\)\), \!\(
\*SubscriptBox[\(\[Limit]\), \(n ->
\*SuperscriptBox[\(5\), \(+\)]\)]\(ArcTan[
\*FractionBox[\(B[n]\), \(A[n]\)]]\)\), \!\(
\*SubscriptBox[\(\[Limit]\), \(n ->
\*SuperscriptBox[\(6\), \(+\)]\)]\(ArcTan[
\*FractionBox[\(B[n]\), \(A[n]\)]]\)\), \!\(
\*SubscriptBox[\(\[Limit]\), \(n ->
\*SuperscriptBox[\(7\), \(+\)]\)]\(ArcTan[
\*FractionBox[\(B[n]\), \(A[n]\)]]\)\), \!\(
\*SubscriptBox[\(\[Limit]\), \(n ->
\*SuperscriptBox[\(8\), \(+\)]\)]\(ArcTan[
\*FractionBox[\(B[n]\), \(A[n]\)]]\)\)},
 PlotRange -> {{0*\[Pi], 2*\[Pi]}, Automatic}, Filling -> Axis,
 Ticks -> {{#, # Pi} & /@ Range[8], Automatic}]
 Attachments:


