If you have a component with DynamicSelect annotation then you can use Mathematica to create an animation.
Here is an example using components from the Fluid library, that have a DynamicSelect annotation.
Model:
package TankExample
model Tank
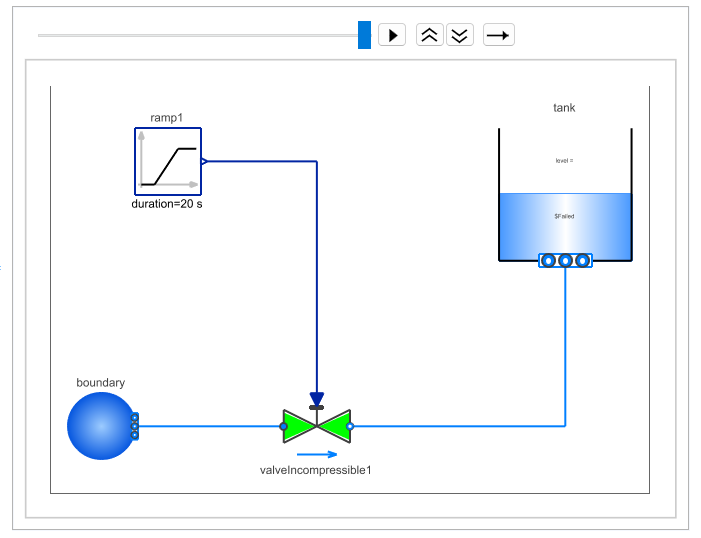
Modelica.Fluid.Valves.ValveIncompressible valveIncompressible1(redeclare replaceable package Medium = Modelica.Media.Examples.TwoPhaseWater, dp_nominal = 10000, m_flow_nominal = 1) annotation(Placement(visible = true, transformation(origin = {-25, -30}, extent = {{-10, -10}, {10, 10}}, rotation = 0)));
Modelica.Fluid.Sources.Boundary_pT boundary(redeclare replaceable package Medium = Modelica.Media.Examples.TwoPhaseWater, nPorts = 1, p = 200000) annotation(Placement(visible = true, transformation(origin = {-90, -30}, extent = {{-10, -10}, {10, 10}}, rotation = 0)));
Modelica.Blocks.Sources.Ramp ramp1(offset = 0.1, height = 0.8, duration = 20) annotation(Placement(visible = true, transformation(origin = {-50, 0}, extent = {{-10, -10}, {10, 10}}, rotation = 0)));
Modelica.Fluid.Vessels.OpenTank tank(redeclare replaceable package Medium = Modelica.Media.Examples.TwoPhaseWater, height = 20, crossArea = 5, nPorts = 1, use_portsData = false, level.start = 1, level_start = 1) annotation(Placement(visible = true, transformation(origin = {50, 40}, extent = {{-20, -20}, {20, 20}}, rotation = 0)));
equation
connect(ramp1.y, valveIncompressible1.opening) annotation(Line(visible = true, origin = {-29.667, -7.333}, points = {{-9.333, 7.333}, {4.667, 7.333}, {4.667, -14.667}}, color = {1, 37, 163}));
connect(boundary.ports[1], valveIncompressible1.port_a) annotation(Line(visible = true, origin = {-57.5, -30}, points = {{-22.5, 0}, {22.5, 0}}, color = {0, 127, 255}));
connect(tank.ports[1], valveIncompressible1.port_b) annotation(Line(visible = true, origin = {28.333, -13.333}, points = {{21.667, 33.333}, {21.667, -16.667}, {-43.333, -16.667}}, color = {0, 127, 255}));
annotation(Icon(coordinateSystem(extent = {{-100, -100}, {100, 100}}, preserveAspectRatio = true, initialScale = 0.1, grid = {10, 10}), graphics = {Ellipse(visible = true, lineColor = {0, 114, 195}, fillColor = {0, 114, 195}, fillPattern = FillPattern.Solid, extent = {{-100, -100}, {100, 100}}), Polygon(visible = true, lineColor = {0, 114, 195}, fillColor = {255, 255, 255}, fillPattern = FillPattern.Solid, points = {{-36, 60}, {64, 0}, {-36, -60}, {-36, 60}})}), uses(Modelica(version = "4.0.0")), Diagram(coordinateSystem(extent = {{-130, -60}, {100, 80}}, preserveAspectRatio = true, initialScale = 0.1, grid = {5, 5})));
end Tank;
annotation(uses(Modelica(version = "3.2.3")), Icon(coordinateSystem(extent = {{-100, -100}, {100, 100}}, preserveAspectRatio = true, initialScale = 0.1, grid = {10, 10}), graphics = {Polygon(visible = true, origin = {0.248, 0.044}, lineColor = {56, 56, 56}, fillColor = {128, 202, 255}, fillPattern = FillPattern.Solid, points = {{99.752, 100}, {99.752, 59.956}, {99.752, -50}, {100, -100}, {49.752, -100}, {-19.752, -100.044}, {-100.248, -100}, {-100.248, -50}, {-90.248, 29.956}, {-90.248, 79.956}, {-40.248, 79.956}, {-20.138, 79.813}, {-0.248, 79.956}, {19.752, 99.956}, {39.752, 99.956}, {59.752, 99.956}}, smooth = Smooth.Bezier), Polygon(visible = true, origin = {0, -13.079}, lineColor = {192, 192, 192}, fillColor = {255, 255, 255}, pattern = LinePattern.None, fillPattern = FillPattern.HorizontalCylinder, points = {{100, -86.921}, {50, -86.921}, {-50, -86.921}, {-100, -86.921}, {-100, -36.921}, {-100, 53.079}, {-100, 103.079}, {-50, 103.079}, {0, 103.079}, {20, 83.079}, {50, 83.079}, {100, 83.079}, {100, 33.079}, {100, -36.921}}, smooth = Smooth.Bezier), Rectangle(visible = true, origin = {0, -5}, lineColor = {198, 198, 198}, fillColor = {238, 238, 238}, pattern = LinePattern.None, fillPattern = FillPattern.Solid, extent = {{-100, -25}, {100, 25}}), Polygon(visible = true, origin = {-0, -10.704}, lineColor = {113, 113, 113}, fillColor = {255, 255, 255}, points = {{100, -89.296}, {50, -89.296}, {-50, -89.296}, {-100, -89.296}, {-100, -39.296}, {-100, 50.704}, {-100, 100.704}, {-50, 100.704}, {0, 100.704}, {20, 80.704}, {50, 80.704}, {100, 80.704}, {100, 30.704}, {100, -39.296}}, smooth = Smooth.Bezier)}));
end TankExample;
Mathematica code to generate an animation:
Step 1: Simulate the model
simDuration = 60000;
modelName = "TankExample.Tank";
sim = SystemModelSimulate[modelName, All, simDuration];
Step 2: Create a symbolic diagram and generate images
symbolicDiag = sim["Diagram", t];
numImages = 10;
images =
  Table[symbolicDiag, {t, 0, simDuration,
    Round[simDuration/(numImages - 1)]}];
Step 3: Create an animation
animation =
 ListAnimate[images, ControlPlacement -> Top,
  AnimationRunning -> False]