Hi everyone,
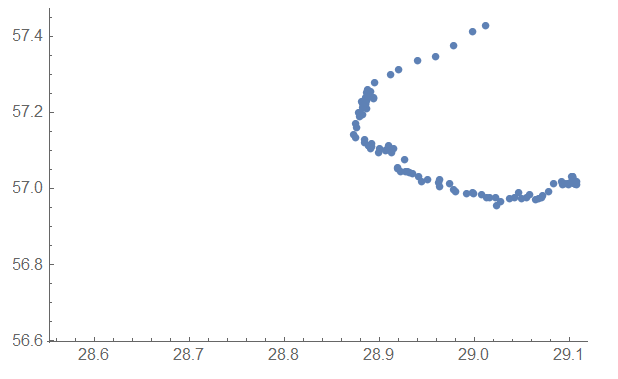
I was trying to fit the following points:
ListPlot[points]
The objective is to reach a function that fits the points, something similar to this: 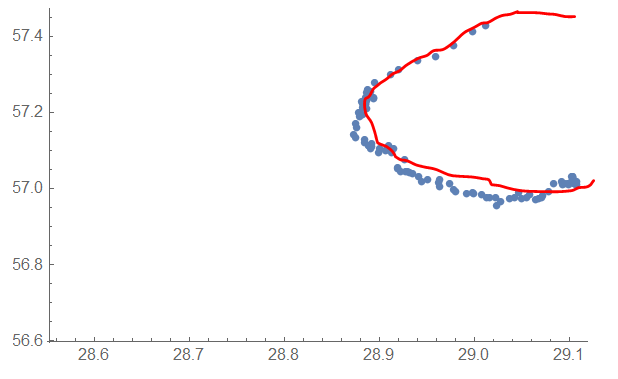
In my understanding, this looks like a right-pointing parabola:
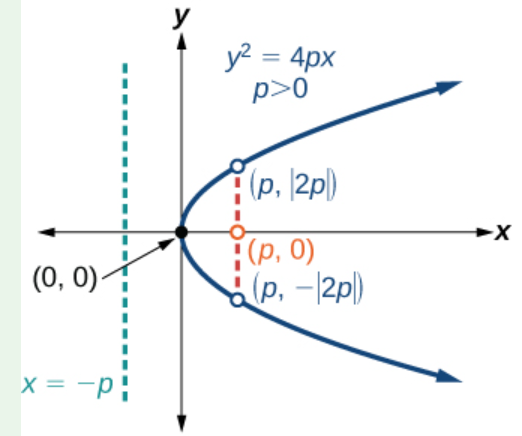 right-pointing parabola
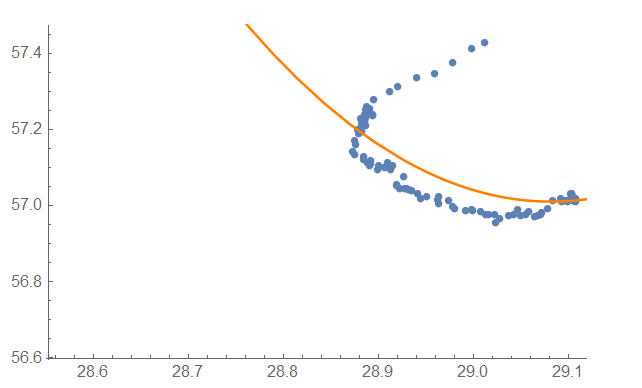
So I tried this function, but it didn't work (the fit was inaccurate):
curveFit= Plot[57.01032231556321` +4.524767722795246` *(-29.0814390274144`+x)^2,{x,28,29.33},PlotStyle->Orange];

Show[points, curveFit]
So I decided to try to fit an ellipse or circle instead, but I don't know how to do it in an automated way(maybe like a Monte Carlo simulation). so I drew an ellipse on top of the points:
h=29.01(*x-coordinate of the center*);
k=57.175(*y-coordinate of the center*);
a=0.13(*radius along the x-axis*);
b=0.2(*radius along the y-axis*);
ellipse = ParametricPlot[{h+a Cos[t],k+b Sin[t]},{t,0,2 Pi},PlotRange->All,AxesLabel->{"x","y"},AxesOrigin->{h-a,k-b},PlotStyle->Orange]

Show[ellipse, points]
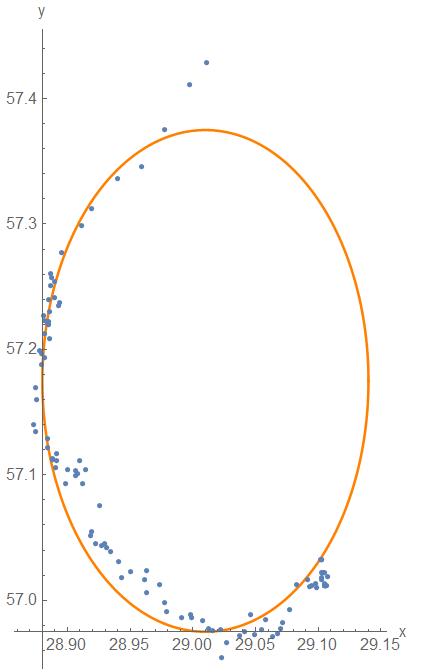
I hope anyone can guide me on the right way to proceed. Thanks in advance.


