This essay walks the reader through using a ResourceData model to create a .GIF file of a camera rotating around a stationary, 3D rabbit composed of points.
Foreward
Motivation
Wolfram Mathematica has many data sources that can easily be accessed and manipulated, such as those in the 3D model portion of the Wolfram Data Repository. The language allows a user to extract a subset of points from the dataset into one to two lines of code. Given a set of points in a 3D model in a list, expressions can be applied to the list to manipulate the points and produce certain visual effects. In this example, we produce the effect of creating a camera that rotates around a stationary object, which can be used to produce an animation of the image that looks like it is rotating.
Expressions Applied
This example uses the following expressions: Clear, ResourceData, RandomPoint, Graphics3D, Table, Sin, Cos, ColorData, ResourceFunction, NotebookDirectory, and Export. Each expression's most relevant reference manual definition is included below.
- Clear[ symbol_1, symbol_2, ... ]: clears values and definitions for the symbol_i.
- ResourceData[ resource ]: gives the primary content of the specified resource.
- RandomPoint[ region, n ]: gives a list of n pseudorandom points uniformly \ distributed in the region.
- Graphics3D[ primitives, options ]: represents a three-dimensional \ graphical image.
- Table[ expr, n ]: generates a list of n copies of expr.
- Sin[ z ]: gives the sine of z.
- Cos[ z ]: gives the cosine of z.
- ColorData[ scheme, property ]: gives the specified property of a color scheme.
- ResourceFunction[ property ]: gives the specified property of the resource.
- NotebookDirectory[]: gives the directory of the current evaluation notebook.
- Export[ destination, expression, format ]: exports data, given in the form of an expression, to the destination, saved in the specified format.
Process
Overview of Steps
To approach this problem, the following steps were taken.
Define constants and variables.
Load data from Wolfram Data Repository.
Create a random subset of points lying within the boundary defined by the 3D model.
Make custom functions to draw the subset of points from various angles.
Animate the renderings of the points.
Export the animation as a .GIF.
With this specific example, we import the 3D model of a rabbit, randomly sample points from its shape, visualize the chosen points by plotting in 3D with color, animate it by applying transformations to the set of points, and finish by exporting the results in the form of a .GIF depicting a rotating rabbit.
Explanation of Constants and Variables
The constants and variables used include
- numberOfPoints: the constant storing the number of points that are used to compose the rendered 3D model rabbit's image. The use of 1000 points was chosen based off of the end animation's point density and code execution time.
- framesPerSecond: a constant storing the number of frames seen in the animation or .GIF per second. 30 frames per second was chosen to match the rate used for live TV shows and the news and provide smooth image transitions.
- rotationDivisions: the constant stating the number of equal increments the camera will move around the 3D image until it reaches its starting spot. For this example, the expression framesPerSecond * 10 was chosen. This was chosen because at 30 frames per second, it should take 10 seconds for the figure to loop completely.
- radius: the constant the states how far the camera is from the point <0, 0, 0> on the 3D graph. A radius of 2 was chosen for this example due to the perspective it gave in the output animation.
- currentColor: a constant that stores the color of the points used to draw the rabbit. The color used in the example is Medium Violet Red.
- currentOutputName: the name of the output file of the .GIF. The current example file has the name "mediumvioletred".
Definitions And Initialization
The following code is used to initialize and define various constants used in the creation of the final animation.
Clear[ currentOutputName, numberOfPoints, currentColor,
radius, framesPerSecond, rotationDivisions ];

(* -- Constants -- *)

(* defining Filepath *)
currentOutputName = "mediumvioletred" ;

(* defining Visual Output *)
numberOfPoints = 1000 ;
currentColor = ColorData["HTML"]["Medium Violet Red"] ;

(* defining Animation *)
radius = 2 ;
framesPerSecond = 30 ;
rotationDivisions = ( framesPerSecond * 10 ) ;
Load Data
The 3D Rabbit model comes from Wolfram Mathematica's inbuilt Data Repository.
rabbitModel: variable storing the rabbit model imported from Mathematica's data repositories. The model is imported using the function ResourceData.
Clear[ rabbitModel ] ;
rabbitModel = ResourceData[ "Stanford Bunny" ] ;
Extract Points from the Rabbit Model
We extract a subset of points from the rabbit model and put them in a list of points.
pointList: the variable storing the list of points used to compose the 3D model rabbit's image. This variable is calculated using the function RandomPoint and the variable rabbitModel.
Clear[ pointList ] ;
pointList = RandomPoint[ rabbitModel , numberOfPoints ];
Create Custom Functions
Next, we make two functions. One draws a rabbit given a list of points. The other generates a table containing all of the viewpoints the camera needs to rotate through to present an image of the rabbit that appears to rotate.
drawRabbit
Given a list of points, drawRabbit plots the points, and draws the rabbit in a specific style. It uses a color, a set of points, a camera viewpoint along a circle with a specified radius around the rabbit, and the view angle of the camera to draw an image of the rabbit. The view angle controls how wide our view of the rabbit is. The rabbit is drawn using the built in function Graphics3D.
Clear[ drawRabbit ] ;
(* -- Function to draw rabbit
Input: Color,
points for rabbit,
camera location,
how large the viewing angle is
*)
drawRabbit[ color_,
points_,
camera_,
viewAngle_]:= Graphics3D[ (* Make a 3D graphic *)
{ color , (* made of points of color *)
Point /@ points } ,
ViewPoint -> camera , (* camera is placed here*)
ViewAngle -> viewAngle , (* bounding area *)
Boxed -> False (* remove grey box outline *)
];
(* -- Example Output
Draw the rabbit in a color, given its input points,
looking at it from the start point of {0,2,0}, and
with a viewing angle of Pi/4
*)
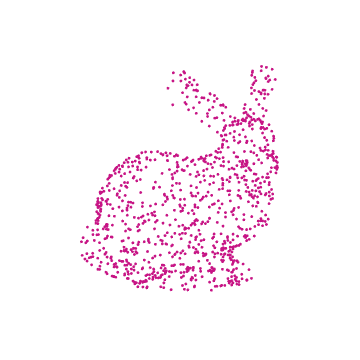
drawRabbit[ currentColor , pointList , {0, 2, 0}, Pi/4 ]
rabbitRotationTable
rabbitRotationTable creates a table composed of rotationDivision rows. Each row contains the locations of the points on the shown graph if the camera is viewing the rabbit from the angle a as an element of the inclusive set [1 , 2 , ... , rotationDivision - 1 , rotationDivision]. This means that it contains all the dot locations that will be rendered sequentially in the image to make it look like the rabbit is spinning.
Clear[ rabbitRotationTable ];
(* Function to create a table of points for a rotating rabbit *)
rabbitRotationTable[ color_,
points_,
rad_,
viewAngle_ ]:=
Table[
(* Expression *)
drawRabbit[ color,
points,
(* the paths of points along a cirlce of radius
rad surrounding the rabbit*)
{rad* Cos[theta], rad * Sin[theta], 0},
viewAngle
],
(* n - a list of angles thetat to rotate through *)
{theta, (* variable *)
0, (* start angle *)
2 * Pi, (* end angle *)
2 * Pi / (rotationDivisions)} (* rotation angle size *)
];
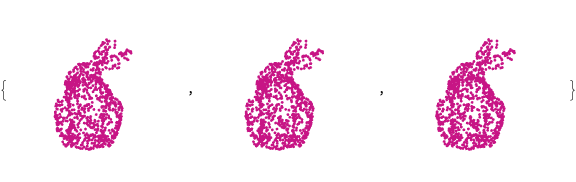
(* Example Output from the Table, the first 3 elements of table *)
rabbitRotationTable[currentColor, pointList, radius, Pi/4][[1;;3]]
Animate Rabbit by Applying Functions to Data
We can use the example outputs from when we constructed the functions to show how the functions apply to data.
Clear [ rotatedRabbitPoints ];
(* Make a table of all the points for a rotating rabbit *)
rotatedRabbitPoints = rabbitRotationTable[currentColor, pointList, radius, Pi/4];
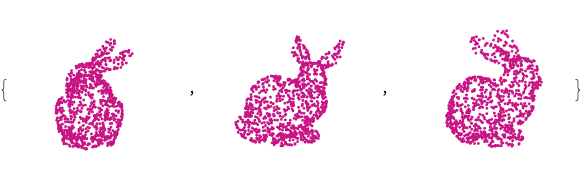
(* view first 1rst, 50th, and 100th elements of list *)
Part[rotatedRabbitPoints, {1, 50, 100}]
Results
in Notebook
Now that we have a table of points defining all of the angles of the rotated rabbit, we can make an animation .
ResourceFunction["SimpleListAnimate"][rotatedRabbitPoints, framesPerSecond ]

Exported GIF format
Writing the animation to a GIF file is just an extra line. Check the notebook's folder to see the gif.
Export[ NotebookDirectory[] <> "Rabbit_"<>currentOutputName<>".gif", (* filepath *)
        rotatedRabbitPoints,                                         (* table of all points *)
        "AnimationRepetitions"->\[Infinity] ];                       (* rotate forever *)
Process in Summary
All the code, collected in one easily copied collection, with a teal rabbit.
(* -- Reset --  *)
Clear[ currentOutputName , numberOfPoints , currentColor ,
       radius , framesPerSecond , rotationDivisions ,
       rabbitModel , pointList,
       drawRabbit, rabbitRotationTable, rotatedRabbitPoints ] ;

(* -- Constants -- *)

(* defining Filepath *)
currentOutputName = "teal" ;
(* defining Visual Output *)
numberOfPoints = 1000 ;
currentColor = ColorData["HTML"]["Teal"] ;
(* defining Animation *)
radius = 2 ;
framesPerSecond = 30 ;
rotationDivisions = framesPerSecond * 10 ;

(* -- Helper Functions -- *)
drawRabbit[ color_,
            points_,
            camera_,
            viewAngle_]:= Graphics3D[                        (* Make a 3D graphic *)
                        { color ,                (* made of points of color *)
                          Point /@ points } ,
                        ViewPoint -> camera ,    (* camera is placed here*)
                        ViewAngle -> viewAngle , (* bounding area *)
                        Boxed -> False           (* remove grey box outline *)
                        ];
rabbitRotationTable[ color_,
                     points_,
                     rad_,
                     viewAngle_ ]:=
                     Table[
                            (* Expression *)
                             drawRabbit[ color,
                                         points,
                                         (* the paths of points along a cirlce of radius
                                            rad surrounding the rabbit*)
                                         {rad * Cos[theta], rad * Sin[theta], 0},
                                         viewAngle
                                         ],
                             (* n - a list of angles thetat to rotate through *)
                             {theta,                         (* variable *)
                              0,                             (* start angle *)
                              2 * Pi,                        (* end angle *)
                              2 * Pi / (rotationDivisions)}  (* rotation angle size *)
                     ];
(* -- Rabbit Model -- *)
(* Basic Model *)
rabbitModel = ResourceData[ "Stanford Bunny" ] ;
pointList = RandomPoint[ rabbitModel , numberOfPoints ];

(* Make a table of all the points for a rotating rabbit *)
rotatedRabbitPoints = rabbitRotationTable[currentColor, pointList, radius, Pi/4];

(* -- Outputs -- *)
(* Animation *)
ResourceFunction["SimpleListAnimate"][rotatedRabbitPoints, framesPerSecond ]
(* GIF *)
Export[ NotebookDirectory[] <> "Rabbit_"<>currentOutputName<>".gif", (* filepath *)
        rotatedRabbitPoints,                                         (* table of all points *)
        "AnimationRepetitions"->\[Infinity] ];                       (* rotate forever *)

Conclusions
We started with the goal of creating a 3D model that appears to rotate. To solve this problem, we break our process down into steps we can complete, such as using available data, extracting points, manipulating sets of points, and plotting and saving the results. The results stem from a set of small steps being completed sequentially and creating a larger result.
The Wolfram Data Repository supplies models such as the Stanford Bunny, which can be used to generate a set of points to represent the model. As any 3D model formatted similarly can be used to create a 3D representation of the model's shape. The larger model can be understood as the collection of points. The strength of this representation can be tested by creating a very dense sampling of points to view the accuracy of the mode. Once we have a representative set of points, applying a transformation or set of transformations uniformly manipulates the shape. In the example shown, the rabbit appears to rotate because the set of points it is represented by undergoes a uniform treatment. Other 3D effects can be created by using different transformations on the set of points.
This project was created while interning at Jack Houng Media Research.


