Message Boards Message Boards

1
|
906 Views
|
4 Replies
|
1 Total Likes
View groups...
Share
Share this post:

NumberLinePlot and Labeling a specific point

Posted 1 year ago

Hello. I am a novice user of mathematica. I am trying to display my research data on NumberLinePlot, and then would like to label the Mean of the data on the plot. I am uuable to figure this out.

For example, I would like to label the 6 with an arrow and call it "mean"

x = Range[11]

Mean[x]

NumberLinePlot[x]
POSTED BY: Atul Aggarwal
4 Replies

Here is a way:

x = Range[11];
NumberLinePlot[x, 
 Epilog -> {Arrow[{{Mean[x], 0}, {Mean[x], 1}}], 
   Text["mean", {Mean[x], 2}]}, PlotRange -> {All, {0, 2}}]
POSTED BY: Gianluca Gorni
Posted 1 year ago

Thank you! This is very helpful.

Do you know also how to space goups of data on NumberLinePlot? 
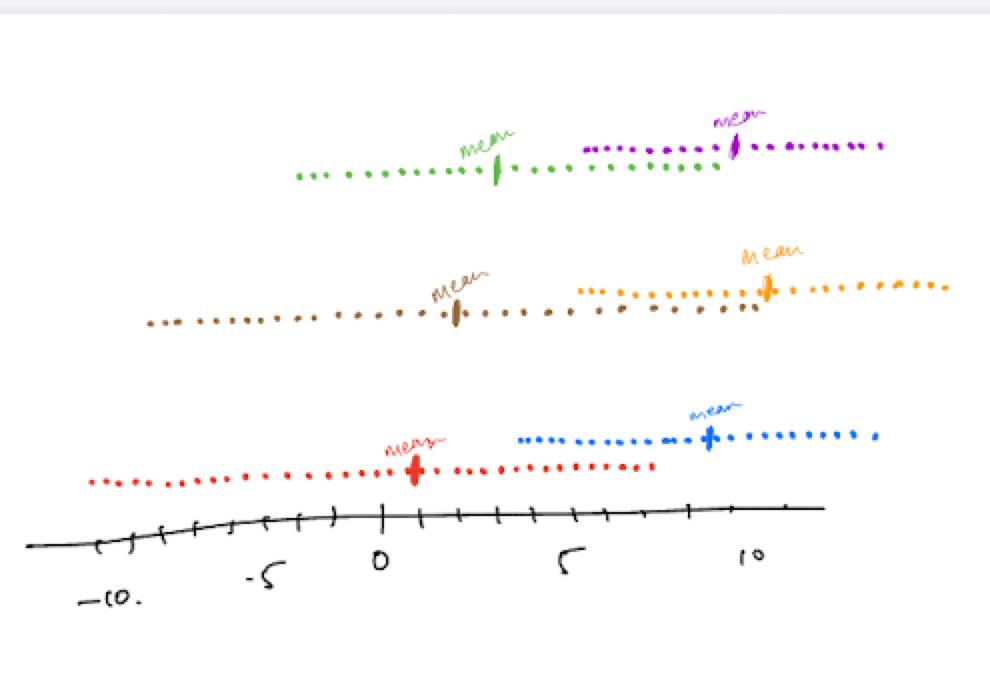
I have 3 paired lists of data: {a,b}, {c,d}, {e,f}. I would like to show the dataset {a,b} as a narrowly spaced data on NumberLinePlot, and then a wide separation for showing {c,d}, and then wide separation for showing {e,f}. I have been playing around with Spacings on Mathematica, but not able to get it right.

Example: enter image description here

POSTED BY: Atul Aggarwal

You can also check the documentation for NumberLinePlot, it is not very difficult:

NumberLinePlot[{Range[20], 2 Range[10], 3 Range[6],
  5 Range[4], 7 Range[2]},
 Spacings -> {.5, .1, .5, .1}]
POSTED BY: Gianluca Gorni
Posted 1 year ago

Thanks everybody. This is working great. Appreciate all the help.

POSTED BY: Atul Aggarwal
Reply to this discussion
Community posts can be styled and formatted using the Markdown syntax.
Reply Preview
Attachments
Remove
or Discard

Group Abstract Group Abstract