Message Boards Message Boards

Place label below plot

Posted 9 months ago

How to place PlotLabels under plot

RadInit = {MeanAround[{3., 2, 2}], MeanAround[{3., 2, 2}], 
   MeanAround[{3., 2, 2}], MeanAround[{3., 2, 2}]};
BarChart[RadInit, ChartElementFunction -> "GlassRectangle", 
 ChartStyle -> "Pastel", ImageSize -> 400,
  ChartLabels -> {"1", "2", "3", "4" }, 
 ChartLegends -> {"1-Mt", "2-MT" ,  "3-RN", "4-RT" }, 
PlotLabel -> Placed["LabelName", Below], 
 LabelStyle -> {FontSize -> 11, FontFamily -> "Courier new", Bold},
 AxesLabel -> {"Sample", "%"}, AxesOrigin -> {.9, 0}, 
 PlotRange -> {{0.12, 3.5}, Automatic}, AspectRatio -> 0.4, 
 BarSpacing -> 0.2, LabelingFunction -> Bottom]

enter image description here

POSTED BY: Ion Ganea
4 Replies

I get no error at all, either with or without quotes. Without quotes the label is read as a product, and the order of factors is rearranged into standard order. Your error message contains Bottom],<<457>>,Bottom], which would mean that in the place of the label the system sees 457 elements, very strange.

POSTED BY: Gianluca Gorni
Posted 9 months ago

ClavN2 = {MeanAround[{5.35, 5.39, 5.37}], MeanAround[{6, 6.05, 6.03}], MeanAround[{6.17, 6.19, 6.26}]}; Labeled[ BarChart[ClavN2, ChartElementFunction -> "GlassRectangle", ChartStyle -> "Pastel", ImageSize -> 250, ChartLabels -> {"1", "2", "3"}, ChartLegends -> {"1.Martor", "2.Reglag" , "3.Biovit" }, LabelStyle -> {FontSize -> 11, FontFamily -> "Courier New", Bold}, AxesLabel -> {"", "%"}, AxesOrigin -> {1.3, 0}, PlotRange -> {{0.12, 3.5}, Automatic}, AspectRatio -> 0.5, BarSpacing -> 0.2, LabelingFunction -> Bottom], Fig . A11 .1 . Nit Content, Bottom] If I use quotes the error appears:

Syntax::tsntxi: "Labeled[BarChart[ClavN2,ChartElementFunction->GlassRectangle,ChartStyle->Pastel,<<7>>,AspectRatio->0.5,BarSpacing->0.2,LabelingFunction->Bottom],<<457>>,Bottom]" is incomplete; more input is needed.

If I remove the quotes the label is wrong
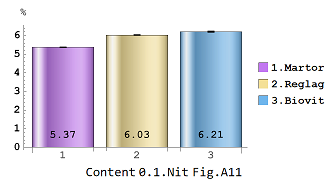
enter image description here

POSTED BY: Ion Ganea

PlotLabel is a very archaic construct. Until Wolfram updates it, you can use Column:

Column[{Plot[x, {x, 0, 1}], "bottom label"}, Center]
POSTED BY: Gianluca Gorni
Posted 9 months ago

You could just wrap Labeled around the whole thing:

Labeled[
  BarChart[...],
  "LabelName",
  Bottom]
POSTED BY: Eric Rimbey
Reply to this discussion
Community posts can be styled and formatted using the Markdown syntax.
Reply Preview
Attachments
Remove
or Discard

Group Abstract Group Abstract