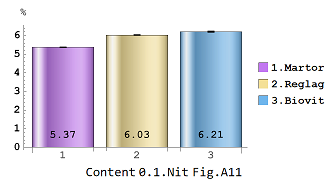
ClavN2 = {MeanAround[{5.35, 5.39, 5.37}], MeanAround[{6, 6.05, 6.03}],
MeanAround[{6.17, 6.19, 6.26}]};
Labeled[
BarChart[ClavN2, ChartElementFunction -> "GlassRectangle",
ChartStyle -> "Pastel", ImageSize -> 250,
ChartLabels -> {"1", "2", "3"},
ChartLegends -> {"1.Martor", "2.Reglag" , "3.Biovit" },
LabelStyle -> {FontSize -> 11, FontFamily -> "Courier New", Bold},
AxesLabel -> {"", "%"}, AxesOrigin -> {1.3, 0},
PlotRange -> {{0.12, 3.5}, Automatic}, AspectRatio -> 0.5,
BarSpacing -> 0.2, LabelingFunction -> Bottom],
Fig . A11 .1 . Nit Content, Bottom]
If I use quotes the error appears:
Syntax::tsntxi: "Labeled[BarChart[ClavN2,ChartElementFunction->GlassRectangle,ChartStyle->Pastel,<<7>>,AspectRatio->0.5,BarSpacing->0.2,LabelingFunction->Bottom],<<457>>,Bottom]" is incomplete; more input is needed.
If I remove the quotes the label is wrong