Group Abstract Group Abstract

Message Boards Message Boards

How to make Linear Regression Graph with TimeSeries (obtained with WeatherData) data

POSTED BY: Pablo Barrios
5 Replies

If you want to know why your version failed, it is almost certainly the replacement of QuantityMagnitude[Missing[_]] by Nothing: this will make some of your entries either an empty list or a one-element list instead of a two-element list, so you no longer have a clean two-column matrix (which is what the error message is telling you).

Note also that when you constructed DataFinal, you put x and y backwards: time should the x, temperature the y.

POSTED BY: Gareth Russell
POSTED BY: Henrik Schachner

That is the answer! Thank you very much!

POSTED BY: Pablo Barrios

Pablo,

maybe this approach might help (I choose a larger time interval to see the effect):

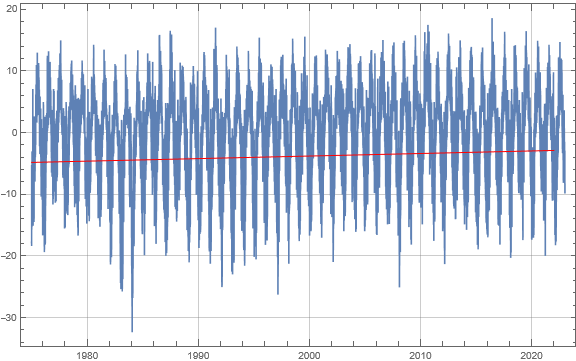
start = DateObject[{1975}, "Year"];
end = DateObject[{2022}, "Year"];
data0 = WeatherData[Entity["City", {"Nuuk", "Sermersooq", "Greenland"}], "Temperature", {start, end, "Day"}];
data1 = data0["Path"];
data2 = {#1, QuantityMagnitude[#2]} & @@@ data1;
lm = LinearModelFit[data2, t, t];
DateListPlot[data0, Epilog -> {Red, Line[{{start, lm[UnixTime@start]}, {end, lm[UnixTime@end]}}]}, GridLines -> Automatic, ImageSize -> Large]

enter image description here

POSTED BY: Henrik Schachner

Can't post the notebook, so here are some additional images: enter image description here enter image description here

POSTED BY: Pablo Barrios
Reply to this discussion
Community posts can be styled and formatted using the Markdown syntax.
Reply Preview
Attachments
Remove
or Discard