When I read Diagram of distribution relationships I immediately thought of built in Wolfram Language function TransformedDistribution. That blog article features the following diagram:
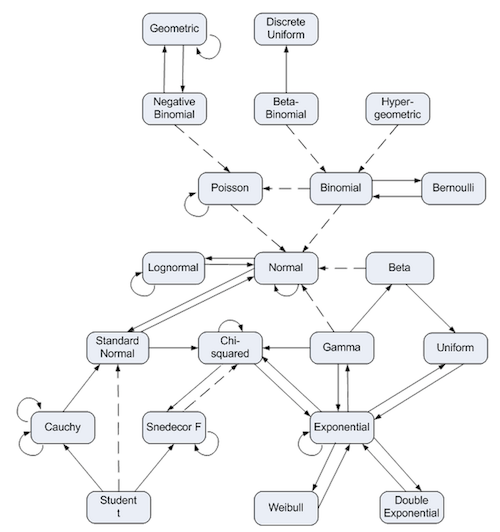
Many of these relationships can be verified. For example well known:
TransformedDistribution[Exp[u], u \[Distributed] NormalDistribution[?, ?]]
LogNormalDistribution[?, ?]
or less known
TransformedDistribution[(u/n)/(v/m), {u \[Distributed] ChiSquareDistribution[n], v \[Distributed] ChiSquareDistribution[m]}]
FRatioDistribution[n, m]
But not only we could verify the diagram, but also discover numerous other relationships. From simple ExponentialDistribution:
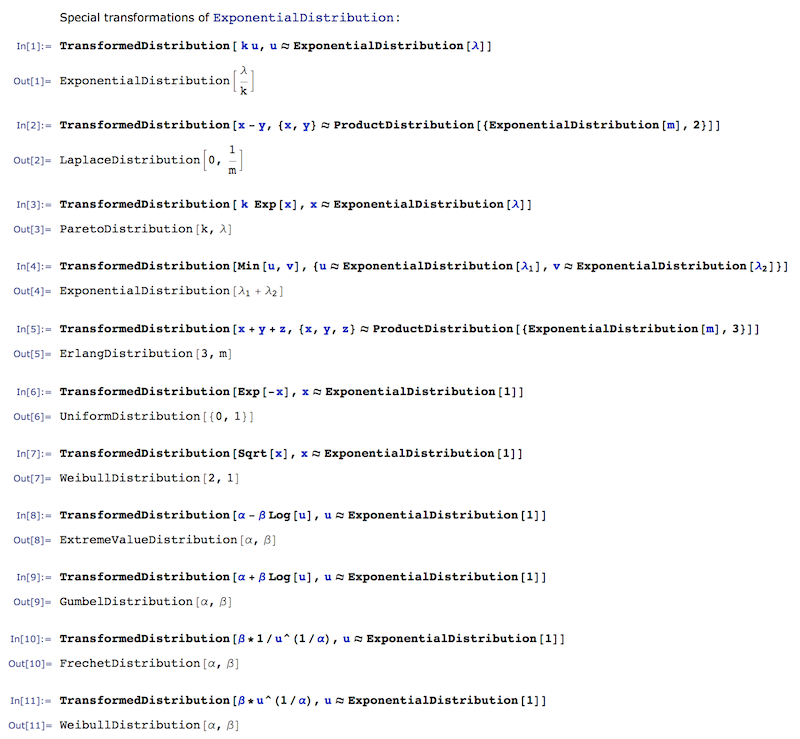
to exotic:
TransformedDistribution[Sqrt[x^2 + y^2], {x, y} \[Distributed] BinormalDistribution[{a, b}, {c, d}, e]]
BeckmannDistribution[a, b, c, d, e]
When Mathematica 8 came out we already had largest distribution support:
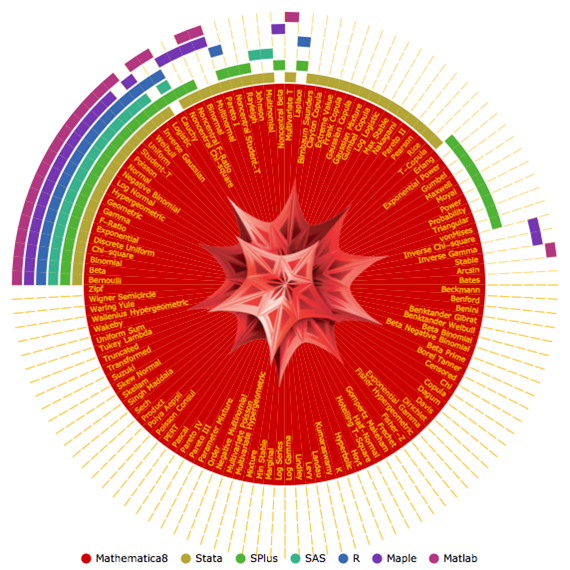
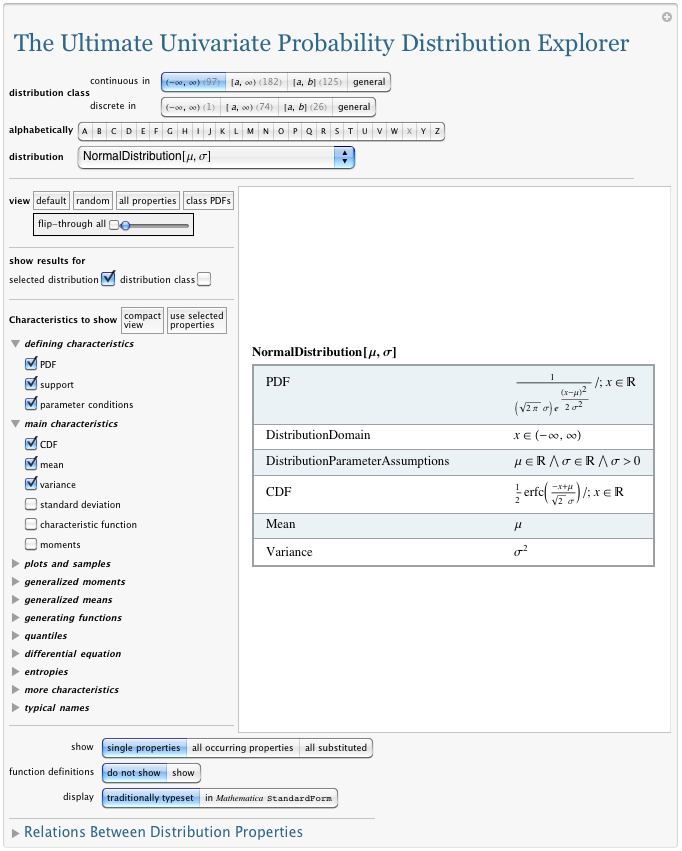
and as you can see fundamental symbolic nature of Wolfram Language allows to go much beyond simple formula listings. As further reading I recommend the blog post The Ultimate Univariate Probability Distribution Explorer.