This is a very nice theorem! Thank you for sharing your clear demonstration of this effect.
As a shy remark: I could not resist making graphical representation of the successively blocked angles.
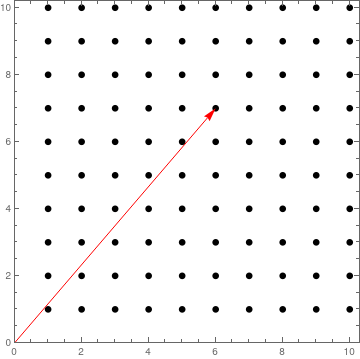
If we have this simple situation:
ClearAll["Global`*"]

latticePts = Flatten[Table[{nx, ny}, {nx, 10}, {ny, 10}], 1];
radius = .1;
demoxy = {6, 7};
bar[p1_, p2_, llength_] := Rectangle[p1, {llength, Last[p2]}]

(* blocked angle range: *)
\[Phi]range = Module[{\[Phi], \[Delta]\[Phi], dist},
     \[Phi] = ArcTan[#1, #2];
     dist = Norm[{#1, #2}];
     \[Delta]\[Phi] = ArcTan[radius/dist];
     {{dist, \[Phi] - \[Delta]\[Phi]}, {dist, \[Phi] + \[Delta]\[Phi]}}] & @@@ latticePts;

Graphics[{Disk[#, radius] & /@ latticePts, Red, Arrow[{{0, 0}, demoxy}]},
 PlotRange -> {{0, Automatic}, {0, Automatic}}, Frame -> True]

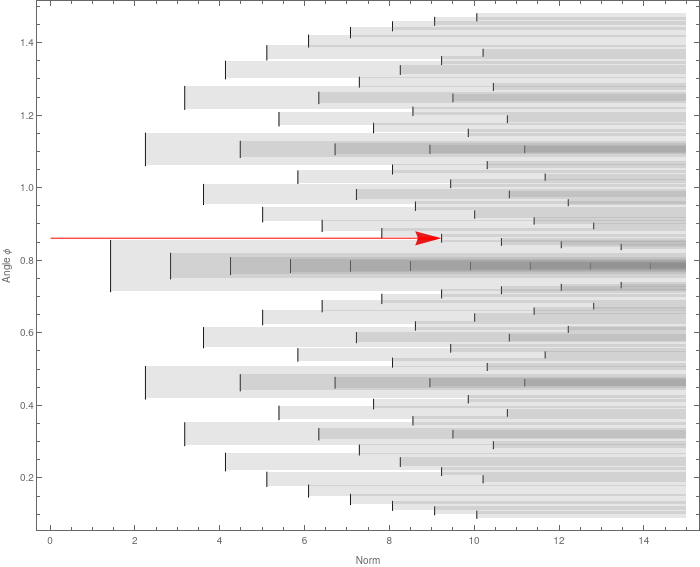
Then the blocked angle ranges look like:
Graphics[{Black, Line /@ \[Phi]range,
  Red, Arrow[{{0, ArcTan @@ demoxy}, {Norm[demoxy],
     ArcTan @@ demoxy}}],Gray, Opacity[.2], bar[#1, #2, 15] & @@@ \[Phi]range},
 AspectRatio -> .8, ImageSize -> 700, Frame -> True, FrameLabel -> {"Norm", "Angle \[Phi]"}]

I think this is at least aesthetically pleasing.