Message Boards Message Boards

0
|
26509 Views
|
3 Replies
|
4 Total Likes
View groups...
Share
Share this post:

"Could not combine the graphics objects in Show[..." error message

Posted 11 years ago

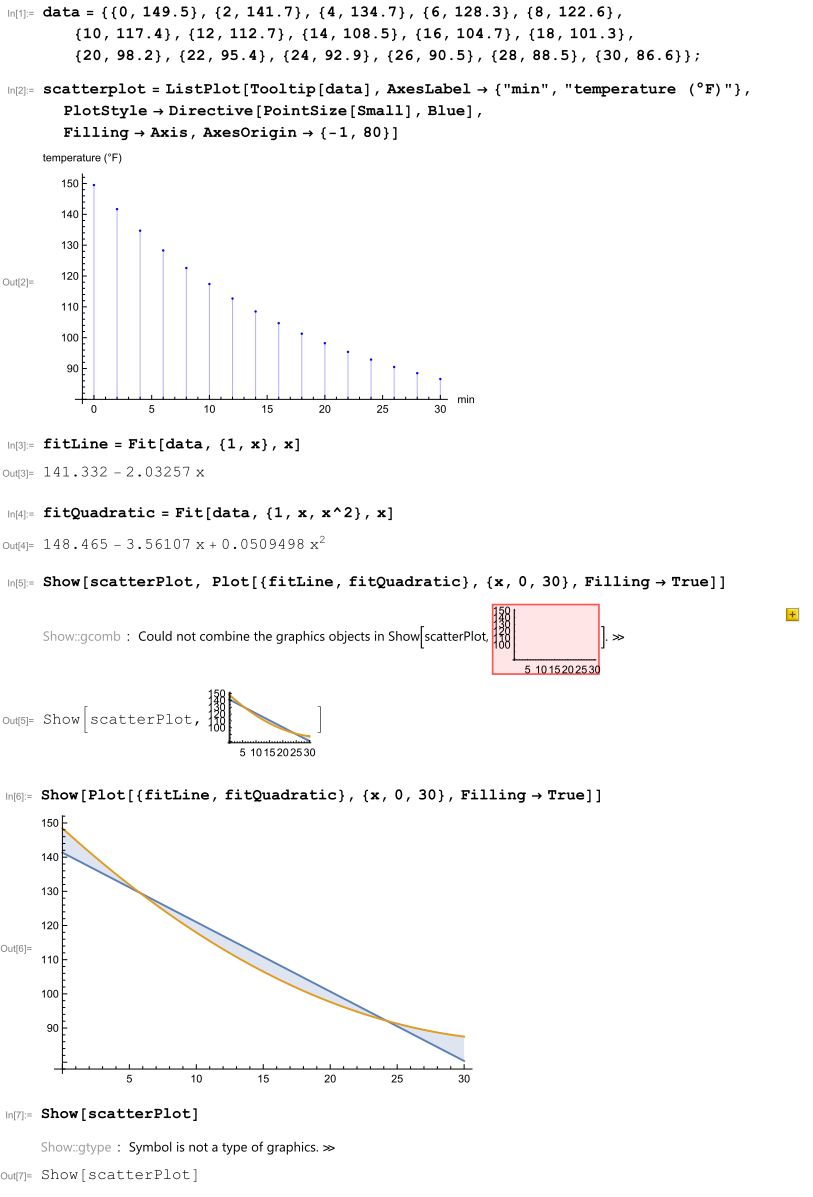
I'm working through "The Student's Introduction to Mathematica, Second Edition" and am on the "Working with Data" section of chapter 3.

The image below shows the steps I followed from this section as well as a couple of additional steps I took in an attempt to troubleshoot the problem that I encountered. The exercise uses a list of points plotted in three different ways and combines/overlays these plots using the Show function. The first plot is a ListPlot which is stored in the scatterplot variable. The other two plots are created using the Plot function inline in the Show function along with the scatterplot variable. The original ListPlot function displays as expected but the Show function returns a "Show::gcomb: Could not combine the graphics objects in Show[..." error when the scatterplot variable is included. The Show function excluding the scatterplot variable displays as expected but the Show function with just the scatterplot variable returns a "Show::gtype: Symbol is not a type of graphics" error.

I have two questions:

1) What is causing these errors? I believe that the book was written for v6 and I am using v10 so I'm wondering if they're due to changes between versions.

2) Is there a way to show the "type" of variables or otherwise peer behind the curtains when troubleshooting in Mathematica? I've been using the documentation quite a bit and I've noticed that it can be somewhat vague about "types" when compared to some of the strongly-typed languages that I've used.

Thanks

P.S. I've attached a copy of the notebook in case someone wants to try this.
Graphics error

Attachments:
POSTED BY: Gary White
3 Replies
Posted 11 years ago

Sorry for the delay in replying and thanks for the answers. I went camping shortly after I posted this and was completely off the grid.

This is a real forehead slapper; I don't know how I missed this. I thought that I was using autocomplete in order to avoid this kind of problem but obviously I missed this one.

POSTED BY: Gary White
Posted 11 years ago

@Gary, there are clues in the error messages that might lead one to the conclusion that scatterPlot is defective. Mouseover of the output error message gives the statement "Skeleton is not a Graphics primitive or directive", suggesting that one of the variables given to Show, possibly scatterPlot, is lacking something. Your last line Show[scatterPlot] gives it's own names as output, showing again that scatterPlot is an empty object. You could write a new line with only scatterPlot and the output would be scatterPlot when it should be a graphics object.

POSTED BY: Gary Palmer

Hi Gary,

that is because you have defined "scatterplot" but you want to show "scatterPlot". For Mathematica that are two different things, because Mathematica is case sensitive. If you use

Show[scatterplot, 
 Plot[{fitLine, fitQuadratic}, {x, 0, 30}, Filling -> True]]

and

Show[scatterplot] 

It will work.

Cheers,

Marco

POSTED BY: Marco Thiel
Reply to this discussion
Community posts can be styled and formatted using the Markdown syntax.
Reply Preview
Attachments
Remove
or Discard

Group Abstract Group Abstract