 Manipulate[Plot[((a/(1 - b)) + (b/(1 - b))*c), {c, 0, 100},
       PlotRange -> {{0, 100}, {0, 300}}, AxesOrigin -> {0, 0},
       AxesLabel -> {"X", "Y"}], {{a, 30}, 0, 50}, {{b, .6}, .0000001, 1}, {{c, 90}, 0, 100}]
you cannot use the same variable c for that task: inside Plot[] as well as dynamic variable. Use x as running variable in the Plot[] instead.
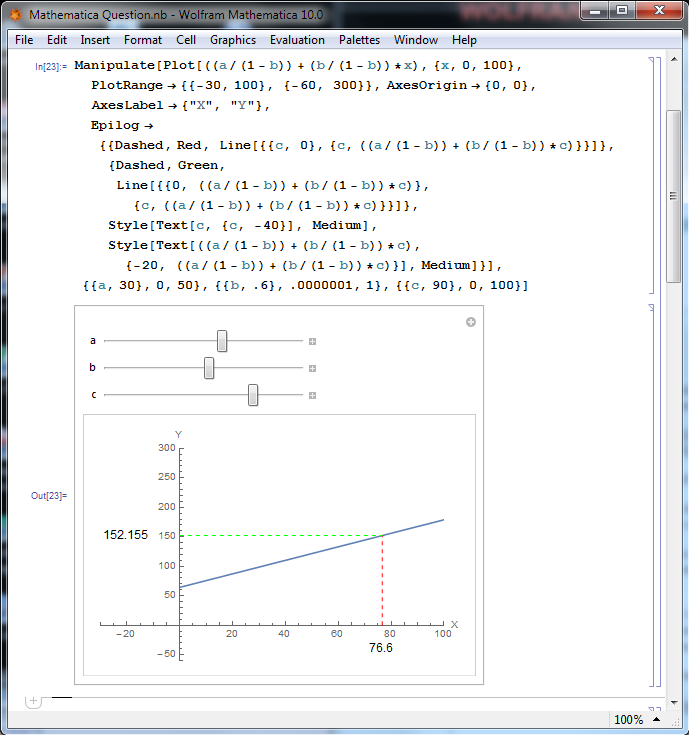
An Epilog with the dynamic variable c does it
Manipulate[Plot[((a/(1 - b)) + (b/(1 - b))*x), {x, 0, 100},
  PlotRange -> {{-30, 100}, {-60, 300}},
  AxesOrigin -> {0, 0}, AxesLabel -> {"X", "Y"},
  Epilog -> {{Dashed, Red, Line[{{c, 0}, {c, ((a/(1 - b)) + (b/(1 - b))*c)}}]},
    {Dashed, Green, Line[{{0, ((a/(1 - b)) + (b/(1 - b))*c)}, {c, ((a/(1 - b)) + (b/(1 - b))*c)}}]},
    Style[Text[c, {c, -40}], Medium],
    Style[Text[((a/(1 - b)) + (b/(1 - b))*c), {-20, ((a/(1 - b)) + (b/(1 - b))*c)}], Medium]}],
  {{a, 30}, 0, 50}, {{b, .6}, .0000001, 1}, {{c, 90}, 0, 100}]
One should also use a function definition in order not to be forced to type in the same function four times, the so called single point of definition principle.