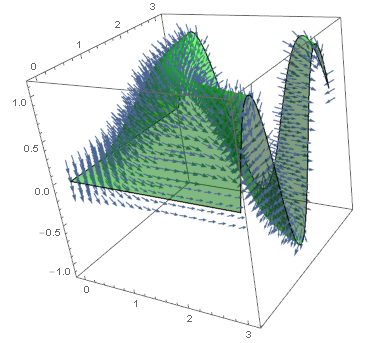
Does the following work for you?
f1[x_, y_] := Sin[x y]
vecF = Normalize[{D[f1[x, y], x], D[f1[x, y], y], -1}];
scalarR = f1[x, y] - z;
vecData = Table[vecF, {x, 0, 3, 0.5}, {y, 0, 3, 0.5}, {z, -1, 1, 0.5}];
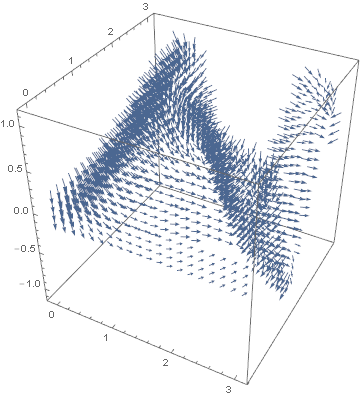
For this, I created a regularly spaced array of vectors in 3D. The iteration on z is for that purpose. The scalar region function, scalarR, is used as the rule for RegionFunction. BTW, it seems like you have a redundant Normalize in your original code, so I left it out.
vG = ListVectorPlot3D[vecData, DataRange -> {{0, 3}, {0, 3}, {-1, 1}},
  VectorPoints -> 20,
  RegionFunction -> Function[{x, y, z}, -0.2 <= scalarR <= 0.2]]
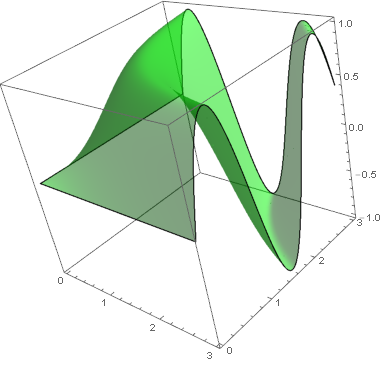
cG = ContourPlot3D[scalarR == 0, {x, 0, 3}, {y, 0, 3}, {z, -1, 1},
  Mesh -> None, ContourStyle -> Opacity[0.5, Green]]
Show[vG, cG]