Hello Pewdi Pie12, welcome to the Wolfram Community and thank you for your first post! You've run into a common issue when switching between linear and logarithmic scales in plotting, especially concerning the behavior of asymptotic analysis plots. But it's not just about the discrepancy between the linear and log modes in your plots, it's not about what the Biostatistics graduate talks are doing.
snr = Range[1, 100];
responseFunction = 10 + 10*Log10[snr];
asymptoticFunction = 20 + Log10[snr];
linearPlot =
  Plot[{10 + 10*Log10[x], 20 + Log10[x]}, {x, 1, 100},
   PlotStyle -> {Red, {Black, Dashed}},
   PlotLegends -> {"Response", "Asymptotic"},
   PlotLabel -> "Linear Scale"];
logPlot =
  Plot[{10 + 10*Log10[x], 20 + Log10[x]}, {x, 1, 100},
   PlotStyle -> {Red, {Black, Dashed}},
   PlotLegends -> {"Response", "Asymptotic"},
   ScalingFunctions -> "Log", PlotRange -> {1, 50},
   PlotLabel -> "Log Scale"];
GraphicsRow[{linearPlot, logPlot}]
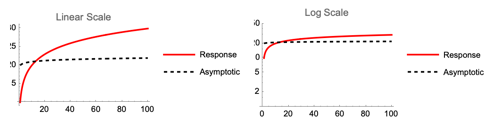
Especially in terms of scale sensitivity and the definition range for log functions (as logarithms of non-positive numbers are undefined). How do logarithmic transformations handle data? We can use Log10 in our functions which inherently prepares them for a logarithmic scale, especially noticeable with the Signal-to-Noise Ratio (SNR) context that you've got with the ScalingFunctions -> "Log" option in the Plot function which gives us the logarithmic scaling to the y-axis. But let's get out of this linear and logarithmic plotting mode and compare the functions on a linear and a logarithmic..y-scale. Maybe your function is too asymptotic for the scaling comparison.
f[x_] := Exp[-x]*Log[x + 1]
g[x_] := 1/x
linearPlot =
  Plot[{f[x], g[x]}, {x, 1, 100},
   PlotStyle -> {Blue, {Red, Dashed}}];
Show[linearPlot]
logYPlot =
  LogPlot[{f[x], g[x]}, {x, 1, 100},
   PlotStyle -> {Blue, {Red, Dashed}}];
Show[logYPlot]
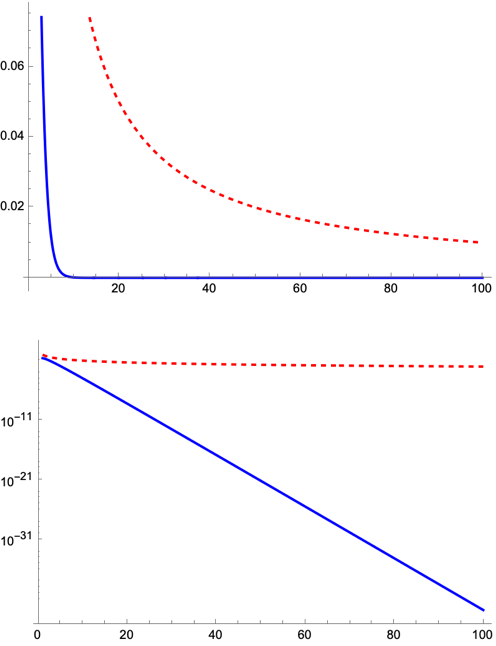
And since we have logarithmic functions that only handle positive values, maybe your y-values are all positive before applying the log scale. Maybe you could have some plot range with the relevant values without extending into ranges where the log function becomes undefined (near zero). The logarithmic transformation might not be as informative as it seems.


