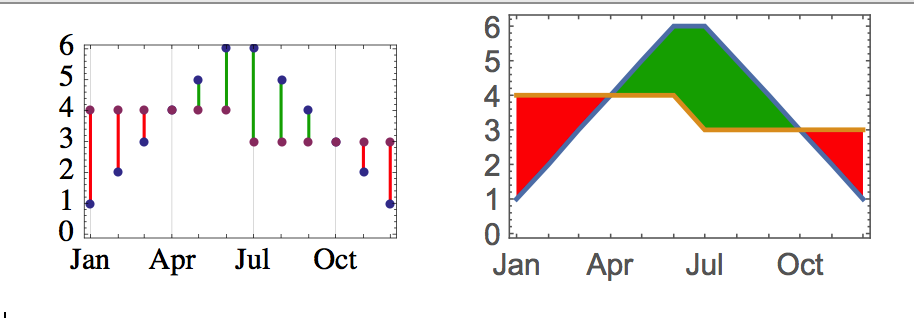
The Mathematica documentation (for both v9 and v10) states "Filling is an option for ListPlot, Plot, Plot3D, and related functions that specifies what filling to add under points, curves, and surfaces." (My emphasis). I would assume that DateListPlot is a related function, but the following code fills quite differently under the current (v10) and previous (v9) versions of Mathematica. This difference does not occur with ListPlot, only with DateListPlot. For my purposes, the new filling gives misleading meaning to the image. I do not think that Filling should display differently in DateListPlot than in ListPlot.
Module[{dates, vals1, vals2, data1, data2, data3},
 dates = Table[{2012, k, 1}, {k, 12}];
 vals1 = {1, 2, 3, 4, 5, 6, 6, 5, 4, 3, 2, 1};
 vals2 = {4, 4, 4, 4, 4, 4, 3, 3, 3, 3, 3, 3};
 data1 = Transpose[{dates, vals1}];
 data2 = Transpose[{dates, vals2}];
 DateListPlot[{data1, data2},
   ImageSize -> {150, 93},
   Axes -> True,
   AxesOrigin -> {AbsoluteTime[data1[[1, 1]]], 0},
   Filling -> {1 -> {{2}, {Red, Darker[Green]}}},
   PlotRange -> Full
   ] // Print;
 ]
v9 and v10 return, respectively: 