I have been trying use the NyquistPlot function to generate a NyquistPlot for the following transfer function:
gLT = (3.55310^-15s^4 - 0.1642s^3 - 0.1243s^2 - 0.00161s + 9.12110^-17) / ( s^5 + 1.825s^4 + 2.941s^3 + 0.03508s^2 + 0.01522s - 1.245*10^-15)
(the Pitch Dynamics for an F16 fighter)
However, when I execute a Nyquist Plot of this in Mathematica, it does not produce the correct result (Matlab and Scilab do produce correct plots).
The Scilab program appears below:
// This file is a test of the Nyquist function in Scilab. It is for an F16 pitch
// dynamics.
s = poly(0, "s")
gstf = syslin("c", (3.553e-15 * s^4 - 0.1642 * s^3 - 0.1243 * s^2 -0.00161 * s + 9.121e-17) ...
/ (s^5 + 1.825 * s^4 + 2.941 * s^3 + 0.03508 * s^2 + 0.01522 * s - 1.245e-15))
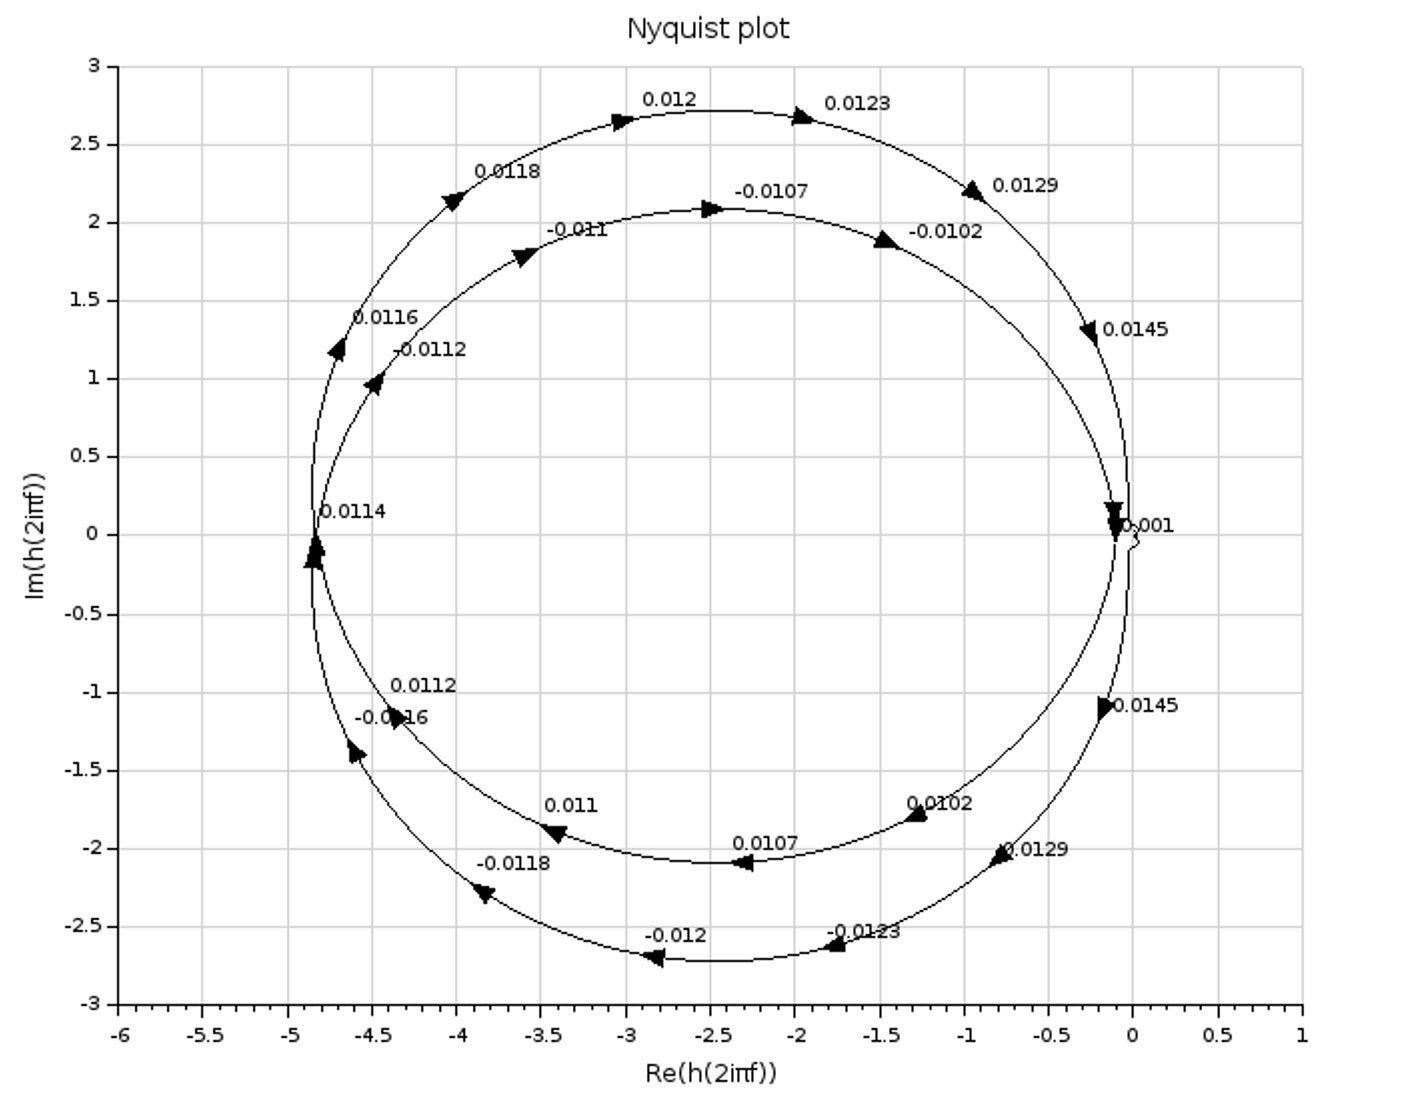
nyquist(gstf)
and the plot produced is:
A Mathematica Notebook with the issues is below
One can see that the Mathematica Nyquist Plot is completely wrong.
Does anyone know what is going on here?
Thanks in advance for any assistance.
Regards,
Robert Betz


