Group Abstract Group Abstract

Message Boards Message Boards

0
|
1.4K Views
|
2 Replies
|
1 Total Like
View groups...
Share
Share this post:

Interpolation of 3D point clouds (non-rectangular shape)

Posted 1 year ago
Attachments:
POSTED BY: Liqin Jin
2 Replies

I get this plotting the Interpolation on your points:

enter image description here

I think you must be doing something different. Please show how you obtained your graphics.

POSTED BY: Michael Rogers
Posted 1 year ago

Hi Michael,

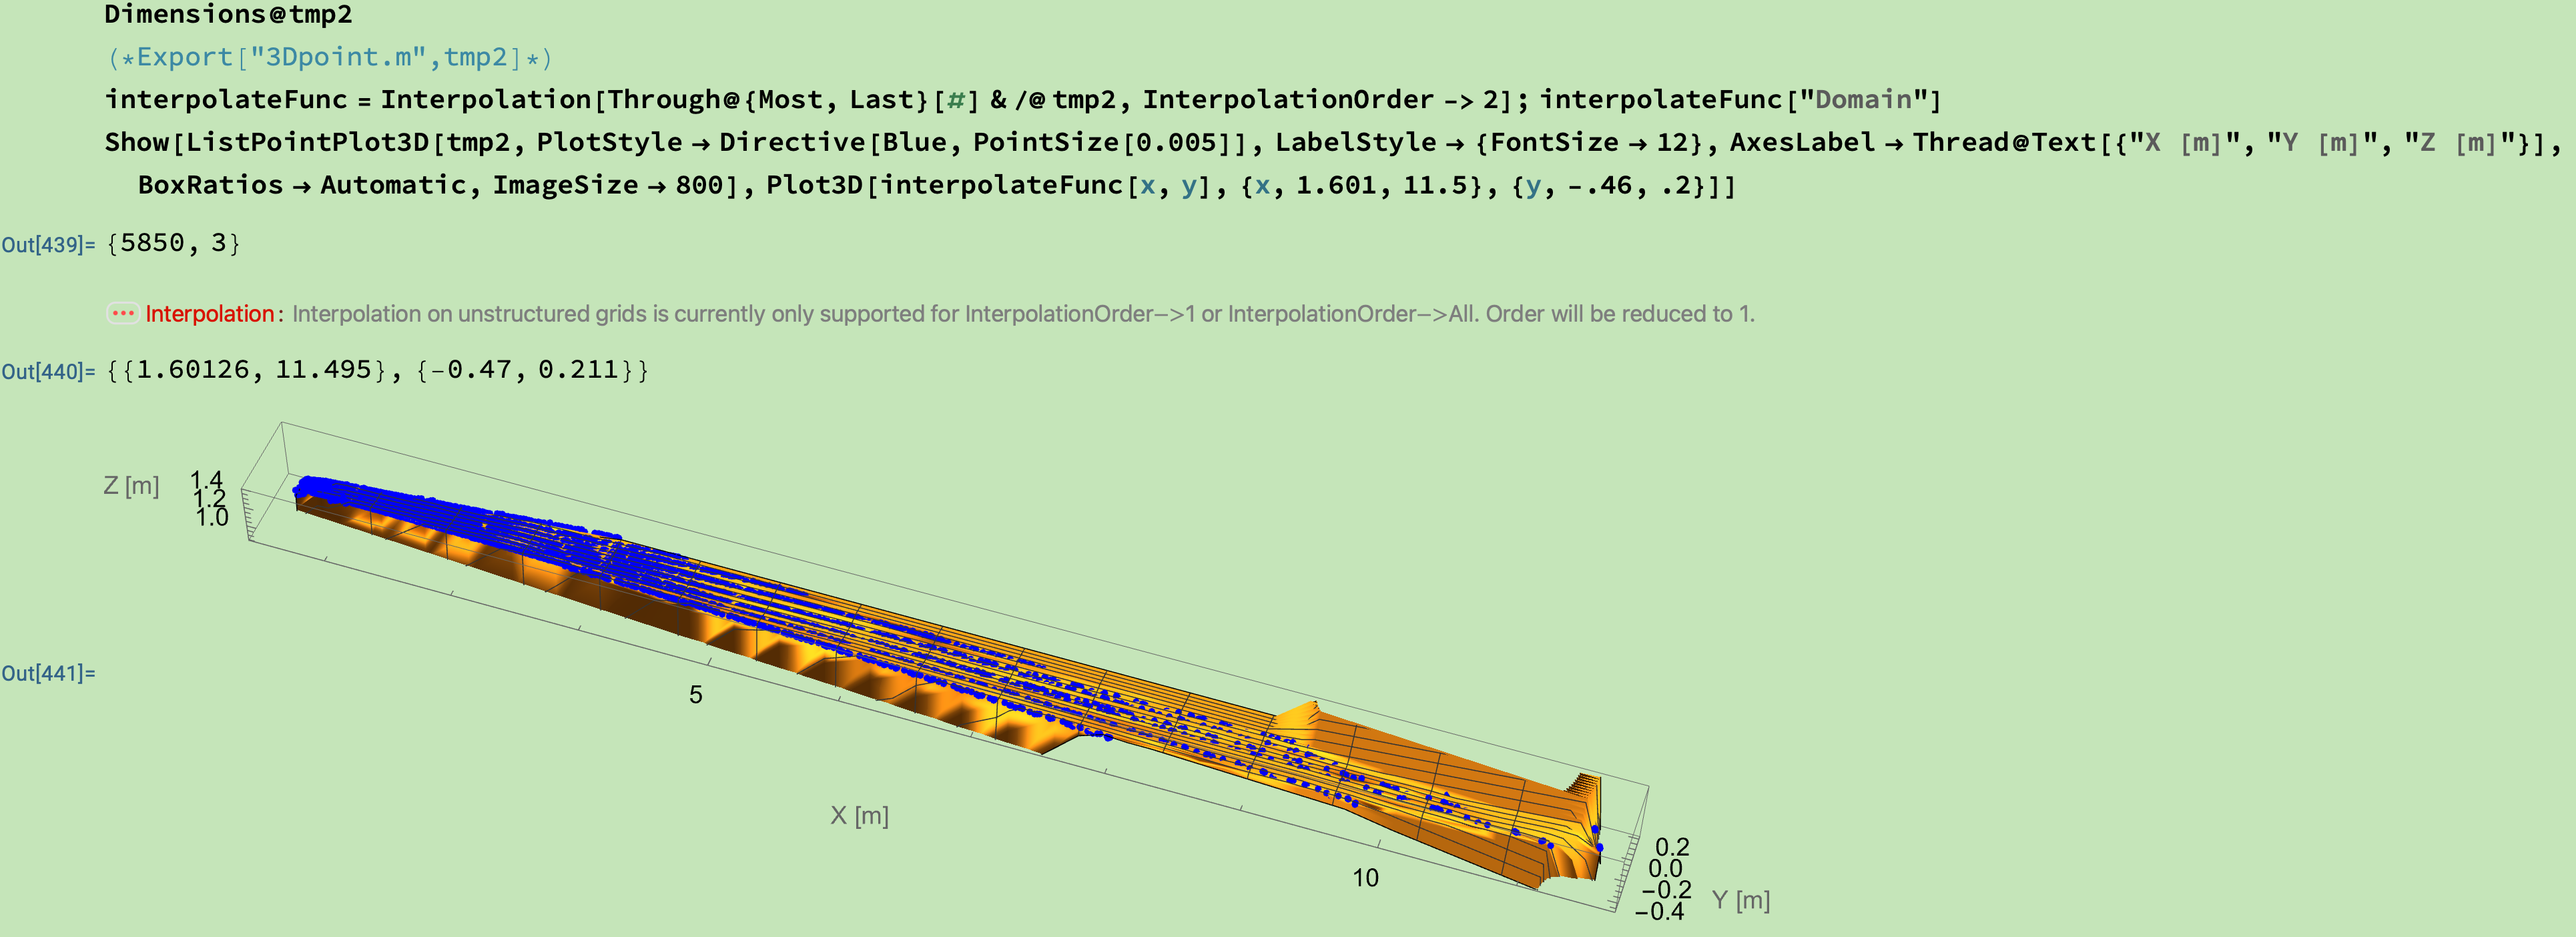
Thank you a lot for your reply. "tmp2" is the array of these 3D points, with the dimensions of {5850,3}. I just use the following command:

interpolateFunc = 
 Interpolation[Through@{Most, Last}[#] & /@ tmp2, 
  InterpolationOrder -> 2]; 
interpolateFunc["Domain"]

Show[ListPointPlot3D[tmp2, 
  PlotStyle -> Directive[Blue, PointSize[0.005]], 
  LabelStyle -> {FontSize -> 12}, 
  AxesLabel -> Thread@Text[{"X [m]", "Y [m]", "Z [m]"}], 
  BoxRatios -> Automatic, ImageSize -> 800], 
 Plot3D[interpolateFunc[x, y], {x, 1.601, 11.5}, {y, -.46, .2}]]

enter image description here

POSTED BY: Liqin Jin
Reply to this discussion
Community posts can be styled and formatted using the Markdown syntax.
Reply Preview
Attachments
Remove
or Discard