I'm making a 3D graph which one of the axis should be a item list instead of numbers, you can see what i mean from the picture, can anyone help me with it? I'm using ListPlot3D to generate the 3D picture. Thanks a lot!
David, That's very elegant! Thank you for sharing.
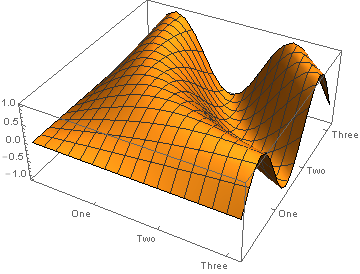
Did you mean something like this?
data = Flatten[
   Table[{x, y, Sin[x y]}, {x, 0, Pi, Pi/19}, {y, 0, Pi, Pi/19}], 1];

ticks = {{1, "One"}, {2, "Two"}, {3, "Three"}};

ListPlot3D[data, Ticks -> {ticks, ticks, Automatic}]
The following is a simple example for how I was thinking of approaching the problem.
(* Mathematica 7 *)
    Plot3D[ Sin[x] Cos[x], {x, -Pi, Pi}, {y, -Pi, Pi},
    AxesLabel -> {
    Rotate[ Grid[{ {"PEAK", " ","TROUGH"}(*Format as needed*)},
    Alignment -> Left
    ], -0.13Pi(*Rotate to align to x-axis for aesthetics*)], "Y", "Z"},
    Ticks -> {None(* Remove x-axis ticks *), Automatic(*Keep Y ticks*), Automatic(*Keep Z ticks*)}]
Thanks a lot, that works nice. I'm still wondering is there a way to Align item names along the axis automatically ?
I think I can use ViewPoint value to calculate the rotation value to resolve this, Thanks!
I think BarChart3D with the ChartLabels option is what you seek. BarChart3D
thanks, but i'm making a real 3d graph which has 3 dimensions of data, like this one below, couldn't use BarChart3D to do that, do you have any other suggestions? Thanks!