Group Abstract Group Abstract

Message Boards Message Boards

Nonlinear fitting of reaction kinetics data with Kronecker delta and bootstrapping

6 Replies

Mathematica can solve with one condition: Prod[0] =0

POSTED BY: Mariusz Iwaniuk

Thank you for your comments. In reply to your comment about accessibility, I did modify my earlier reply to you with a remark stating that I would be happy to share the text of that original publication with anyone who contacts me ( buhlmann@umn.edu ). I stated in my earlier reply that the three different data sets that are fitted simultaneously represent different spectral features. For those who dig deep and look at that publication, they will see that these spectral features refer to NMR spectroscopy (nuclear magnetic resonance spectroscopy). For those not familiar with this technique, let me give an example that is different but would follow a similar logic. Imagine a purple compound reacted in a chemical reaction to give a green product. Three different data sets would be the intensity of absorption of red and blue light of the reacting compound, and the intensity of absorption of green light of the product. Averaging the different data sets would not make any sense, but as all three data sets represent the same reaction, the same set of ODEs. And why is it preferable to solve the ODEs and not just make a fit with any function that gives a nice fit. The reaction constant, kzero, cannot be obtained from a fit with any function that gives a nice fit. It can only be obtained from using a physically meaningful model, as one gets it from solving the ODEs. That reaction constant, kzero, is a very useful parameter as it can be used to predict the speed of reaction of experiments that have not been performed, for example with different concentrations of the reacting compound. Hope that helps.

POSTED BY: Daniel Lichtblau

From the initial attempt to fit the data I gather that Ald is the benzaldehyde. The data has numerous y values for the same x values though. Was this from multiple experiments? If so, it would make sense to perhaps ,average those y values.

Maybe more important is the question of what exactly is needed. Is it the DE solution? Or identification of the parameter value for kzero? If the latter, I would suggest using ParametricNDSolve, especially if there are known values for initial concentrations. One could proceed like so, using data from this post's notebook.

Average the values:

newdatabenz = 
 Map[{#[[1, 1]], Mean[#[[All, 2]]]} &, SplitBy[databenz, First]]

(* Out[118]= {{0., 0.0174805}, {361., 0.0102426}, {659., 
  0.006913}, {944., 0.00504}, {1241., 0.00391667}, {1528., 
  0.0037}, {1825., 0.00334333}} *)

Get a parametricized numeric ODE solution function for the aldehyde.

solP = ParametricNDSolveValue[{Ald'[t] == -kzero Ald[t] Hydr[t],
    Hydr'[t] == -kzero Ald[t] Hydr[t],
    Prod'[t] == kzero Ald[t] Hydr[t], Ald[0] == .026, Hydr[0] == .025,
     Prod[0] == 0}, Ald, {t, 0, 2000}, kzero];

Find a fit to the averaged data:

(* kzfit = 
 FindFit[newdatabenz, solP[kzero][t], {{kzero, .1}}, t]

Out[121]= {kzero -> 0.181871} *)

Plot the solution curve and data points:

kzval = kzero /. kzfit;
Show[ListPlot[newdatabenz, PlotStyle -> PointSize[0.025]], 
 Plot[solP[kzval][t], {t, 0, 1825}, PlotRange -> All],
 PlotRange -> All]

enter image description here

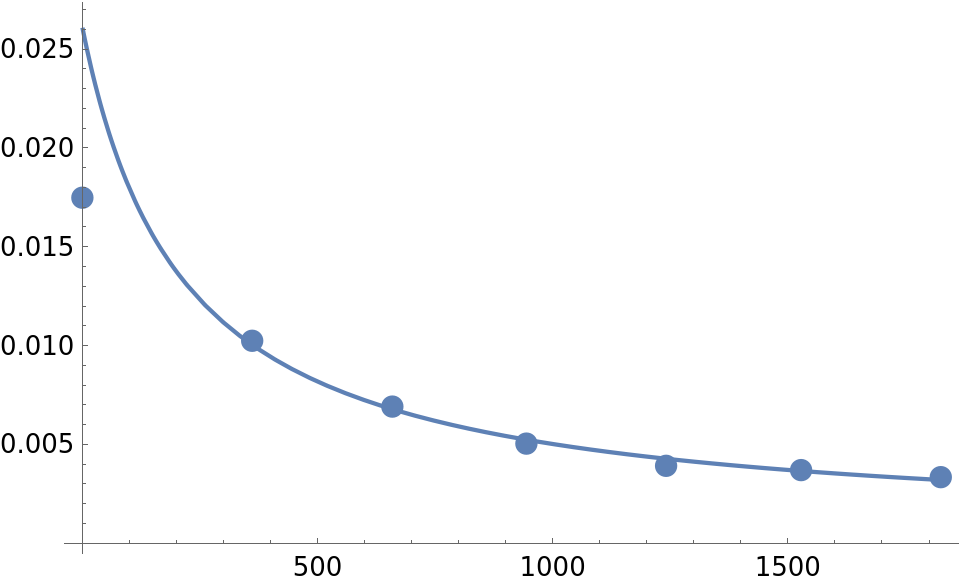
Not bad except for the first point.

POSTED BY: Daniel Lichtblau

enter image description here -- you have earned Featured Contributor Badge enter image description here Your exceptional post has been selected for our editorial columns Staff Picks http://wolfr.am/StaffPicks and Publication Materials https://wolfr.am/PubMat and Your Profile is now distinguished by a Featured Contributor Badge and is displayed on the Featured Contributor Board. Thank you!

POSTED BY: EDITORIAL BOARD
Reply to this discussion
Community posts can be styled and formatted using the Markdown syntax.
Reply Preview
Attachments
Remove
or Discard