Here's a slight refactoring of the code Mariusz adapted from Henrik that takes advantage of vectorization of math functions on my Mac M1. There is similar vectorization on Intel machines, but I cannot test them. Performance may vary. The vectorized functions evaluate vectors of input in parallel taking advantage of special CPU instructions (google SIMD). These usually evaluate large vectors of input more efficiently than a listable, parallelizable compiled function in Mathematica. However, the evaluation environment can get muddied by vectorized and nonvectorized operations, so that it is not always the case that a partially vectorized function will beat out a compiled function. In this case, I think it does for testSquare[]. I'll demonstrate the Gauss-Kronrod rule, because I can use it to estimate the error. One could also estimate the error in the Gauss rule by running it again with a different order and subtracting. The higher order rule generally has an error less than the difference, when the function has smooth derivatives up to the order of the rule.
I used Russell's initial formula to do a little optimization.
Clear[x, y, w, z, \[Lambda], \[Xi], \[Eta]]

z Exp[I 2 \[Pi] (
     x^4 (-15 y^4 + 12 y^2 z^2 - 8 z^4) +
      8 z^4 (-y^4 + 4 y^2 z^2 + 8 z^4) +
      4 x^2 (3 y^4 z^2 - 4 y^2 z^4 + 8 z^6))/(
     64 z^7 \[Lambda])]/(x^2 + y^2 + z^2) /. {x -> x1, y -> y1,
  x^2 -> x2, x^4 -> x2^2, y^2 -> y2, y^4 -> y2^2(*,z^2->z2,z^4->z4,
  z^6->z6,z^7->z7*)}
(*
(E^((I \[Pi] (x2^2 (-15 y2^2 + 12 y2 z^2 - 8 z^4) +
    8 z^4 (-y2^2 + 4 y2 z^2 + 8 z^4) +
    4 x2 (3 y2^2 z^2 - 4 y2 z^4 + 8 z^6)))/(
 32 z^7 \[Lambda])) z)/(x2 + y2 + z^2)
*)
Here's is the optimized function. Subtract[a, b] and Divide[a, b] are usually available in vectorized forms. In normal Mathematica input and evaluation, when the arguments are not numbers or numeric arrays, they automatically change to Plus[a, Times[-1, b]] and Times[a, Power[b, -1]], respectively, which are somewhat less efficient. In Henrick's Outer[] code, the function is called with all input numeric or numeric arrays, so the efficient version of the arithmetic will be done. We will also make one other improvement. Instead of called testSquare[] twice, one for Re[] and once for Im[], we will call it and save the complex values. We can extract the real and imaginary parts later. (Sorry for all the details.)
testSquareG = Function[{x, y, w, z, \[Lambda], \[Xi], \[Eta]},
   With[{x2 = Subtract[x, \[Xi]]^2, y2 = Subtract[y, \[Eta]]^2},
    Divide[z, x2 + y2 + z^2] Exp[I \[Pi] *
       Divide[
        (x2^2 (-15 y2^2 + (12 z^2) y2 - 8 z^4) +
          8 z^4 (-y2^2 + (4 z^2) y2 + 8 z^4) +
          4 x2 ((3 z^2) y2^2 + (-4 z^4) y2 + 8 z^6)),
        32 z^7 \[Lambda]]
      ]
    ]
   ];

{pts, weights, errweights} = (* this is the same except for the Rule *)
  NIntegrate`GaussKronrodRuleData[5, MachinePrecision];
m = 20;(*If the m parameter is greater,than is better resolution*)
n = 20;(*If the n parameter is greater,than is better resolution*)
w = 200.;(* w = 200 *)
z = 1000.;(* z = 1000 *)
\[Lambda] = 1.;(* \[Lambda] = 1 *)
\[Xi]data = Partition[Subdivide[-w/2, w/2, m], 2, 1];
\[Eta]data = Partition[Subdivide[-w/2, w/2, n], 2, 1];
{\[Xi], \[Eta]} = Transpose[
   Tuples[{Flatten[\[Xi]data . {1. - pts, pts}],
     Flatten[\[Eta]data . {1. - pts, pts}]}]];
\[Omega] = Flatten[KroneckerProduct[
    Flatten[KroneckerProduct[Differences /@ \[Xi]data, weights]],
    Flatten[KroneckerProduct[Differences /@ \[Eta]data, weights]]]];
\[Epsilon] = Flatten[KroneckerProduct[ (* for estimating error *)
    Flatten[KroneckerProduct[Differences /@ \[Xi]data, errweights]],
    Flatten[KroneckerProduct[Differences /@ \[Eta]data, errweights]]]];

WW = {x, y} |-> {x, y, (* complex values of  testSquareG function !!! *)
  testSquareG[x, y, w, z, \[Lambda], \[Xi], \[Eta]] . \[Omega]};
X = 150.;(*Range for: X\[Element](-150,150) *)
Y = 150.;(*Range for: Y\[Element](-150,150) *)
dataC = Outer[WW, Subdivide[-X, X, 100], Subdivide[-Y, Y, 100]]; //
  AbsoluteTiming // First

ListPlot3D[Flatten[Re@dataC, 1], PlotRange -> All,
 AxesLabel -> {"x", "y", "Z"}, ColorFunction -> "Topographic",
 PlotLabels -> HoldForm[Re[testSquareG[x, y]]]]
ListPlot3D[Flatten[MapAt[Im, dataC, {All, All, 3}], 1],
 PlotRange -> All, AxesLabel -> {"x", "y", "Z"},
 ColorFunction -> "Topographic",
 PlotLabels -> HoldForm[Im[testSquareG[x, y]]]]
The plots are similar to Mariusz's. With the Gauss-KronrodRule, we can examine the error estimate:
errWW = {x, y} |-> testSquareG[x, y, w,
     z, \[Lambda], \[Xi], \[Eta]] . \[Epsilon]; (* GK error estimates *)
X = 150.;(*Range for: X\[Element](-150,150) *)
Y = 150.;(*Range for: Y\[Element](-150,150) *)
err = Outer[errWW, Subdivide[-X, X, 100], Subdivide[-Y, Y, 100]]; //
  AbsoluteTiming // First

(*  15.093  *)

err // Flatten // RealExponent //
 ListPlot[#, PlotLabel -> Element[HoldForm@Log10@Abs[err], MinMax[#]]] &
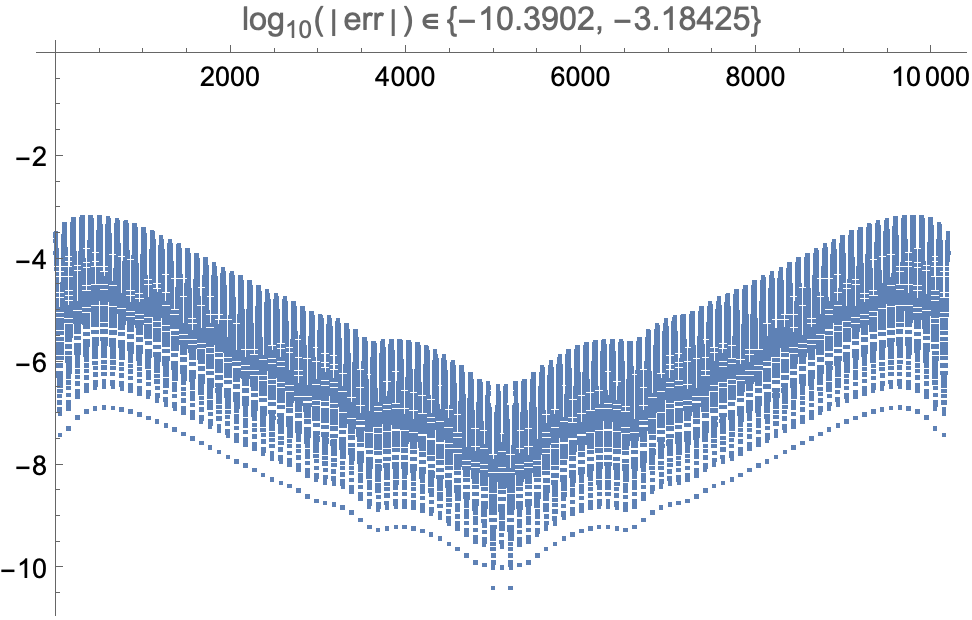
If we increase the order to NIntegrate`GaussKronrodRuleData[7, MachinePrecision], it takes 25 sec. instead of 15, and the error drops to between 10^-14 and 10^-7.
Addendum
FWIW, we can mimic Mariusz's and Henrik's approach with NIntegrate[] as follows It won't be nearly as fast as the raw integration code (it takes 100 sec., half the time Mariusz's NIntegrate[] mathod takes on my Mac). However, it may be easier to understand.
testSquareF[x_?NumericQ, y_?NumericQ, w_?NumericQ, z_?NumericQ, \[Lambda]_?NumericQ] :=
  NIntegrate[(E^((I \[Pi] (8 z^4 (8 z^4 +
          4 z^2 (y - \[Eta])^2 - (y - \[Eta])^4) +
       4 (8 z^6 - 4 z^4 (y - \[Eta])^2 +
          3 z^2 (y - \[Eta])^4) (x - \[Xi])^2 + (-8 z^4 +
          12 z^2 (y - \[Eta])^2 - 15 (y - \[Eta])^4) (x - \[Xi])^4))/(
    32 z^7 \[Lambda])) z)/(
   z^2 + (-y + \[Eta])^2 + (-x + \[Xi])^2), {\[Xi], -w/2,
    w/2}, {\[Eta], -w/2, w/2}, PrecisionGoal -> 4, MinRecursion -> 4,
   MaxRecursion -> 4, Method -> {"GaussKronrodRule", "Points" -> 7}];

With[{n = 4(*If the n parameter is smaller, than is better resolution*)},
  ListPlot3D[
   Partition[
    Flatten[ParallelTable[{x, y,
       Re[testSquareF[x, y, 200, 1000, 1]]}, {x, -150, 150,
       n}, {y, -150, 150, n}, Method -> "FinestGrained"]], 3],
   ColorFunction -> "Topographic",
   PlotLabels -> HoldForm[Re[testSquareF[x, y]]]]] // AbsoluteTiming

(* picture like Mariusz's *)


