First of all, you have some misprints.
Please check if I fix them correctly.
 Clear[f, a, c, \[Omega], Q, M];
 a = 0.5;
c = 0.2;
\[Omega] = -3^(-1);
Q = 0.7;
M = 10;

f[r_, P_] :=
  1. - (a*Q^4)/(20*r^6) + Q^2/r^2 - (2*M)/r + (8/3)*P*Pi*r^2 -
   c*r^(-1 - 3*\[Omega]);
Next, I strongly recommend using NSolve instead of Solve in this case.
Equation
$f(r,P)=0$ has at least two solutions.
NSolve[f[r, 1.] == 0, r, Reals]
{{r -> -0.192412}, {r -> 1.30415}}
I guess r it's a radius, so we're going for the positive.
But you can change that.
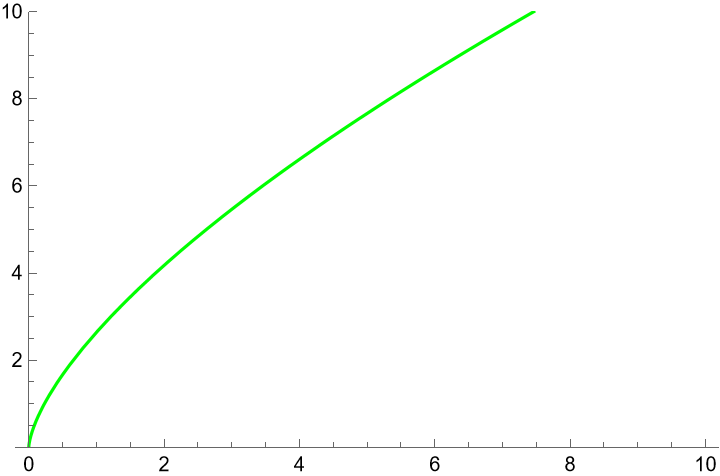
Finally, before plot a function it is desirable to define it separately.
Clear[fPlot];
fPlot[P_] :=
  D[f[r, P], r]/(4*Pi) /.
   First@ NSolve[f[r, P] == 0 && r > 0, r, Reals];

Plot[fPlot[P], {P, 0, 10}, PlotRange -> {0, 10}, PlotStyle -> Green,
 AxesOrigin -> {0, 0}]
