Introduction
In this notebook, we will explore a simple technique for simulating 2D incompressible fluids for visual effects. This work is mostly based on Jos Stam. Stable Fluids SIGGRAPH 1999 as well as a tutorial by Karl Sims
Working with a Grid
Here we will use the Euler method to represent a fluid, i.e., by storing velocity as a vector field discretized to a uniform grid.
grid = Table[Cross[{i,j,0}, {0,0,1}][[;;2]], {i, 5}, {j, 5}];
% // MatrixForm
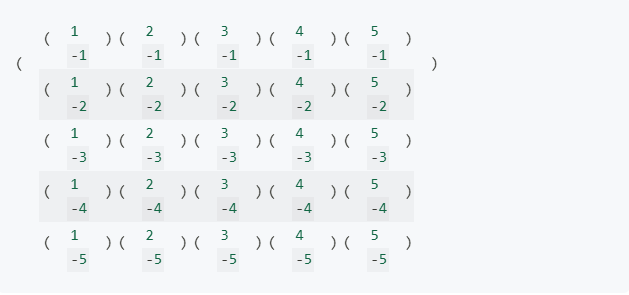
Then one can easily visualize it as a vector field:
grid // ListVectorPlot
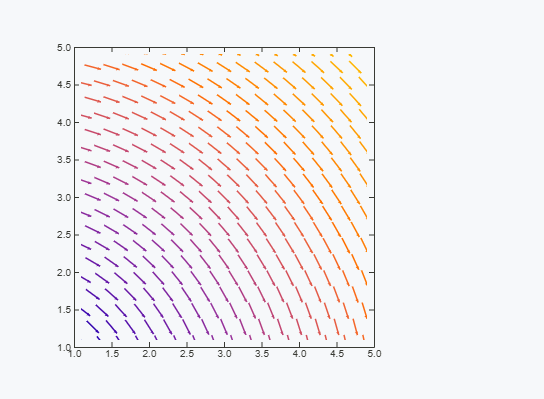
For the best performance, we will use Map or MapIndexed with a pure function inside. Then Wolfram Kernel is able to use JIT compilation. For example:
Map[Function[vector, ({{0, -1}, {1, 0}}) . vector], grid, {2}]
ListVectorPlot[%]

Custom Syntax Sugar
Another possibility to visualize using pure syntax sugar would be to define our own output form for a single velocity vector.
The most efficient way is to define a decorator function in Javascript. Let it be a small arrow pointing to a desired direction.
.js
core.ArrowGuide = async (args, env) => {
const dir = await interpretate(args[0], env);
const mag = dir.map ((el) = > el*el).reduce ((c, a) = > c + a);
const angle = Math.round(180*Math.atan2(dir[0], dir[1])/Math.PI);
console.log(angle);
env.element.style.transform = `rotate(${angle}deg) `;
if (mag < 0.01) { // do not display if it is too small env . element . style .
opacity = 0.5;
env.element.innerHTML = ".";
} else {
env.element.innerHTML = "↑";
} }

Now we define a standard form ArrowGuide, which will use the defined Javascript function to display itself inside a cell.
ArrowGuide /: MakeBoxes[a_ArrowGuide, StandardForm] :=
 ViewBox[a // First, a]
The first argument will be an actual expression used as input; First will break our wrapper and substitute an original vector.
ArrowGuide[{1,1}]

Now one can do some cool tricks like this one:


Now we can basically apply this decoration wrapper to our matrix using multidimensional Map function and then again output it as a matrix
Map[ArrowGuide, grid, {2}] // MatrixForm
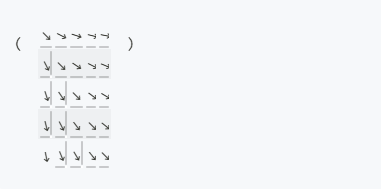
Let's define a helper function
showAsMatrix[l_] := Map[ArrowGuide, l, {2}] // MatrixForm
Divergence
Conservation of mass for incompressible fluid dictates
div v=0
where v is velocity vector field we played with earlier - grid.
Example
Let us start with a simple example
grid = Table[{0, 0}, {i, 5}, {j, 5}];
grid // showAsMatrix

And put a single vector in the middle
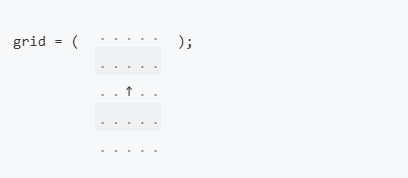
To visualize the divergence, one can use DensityPlot
{intX, intY} = {ListInterpolation[grid[[All, All, 1]]],
   ListInterpolation[
    grid[[All, All,
     2]]]}; (*BB[*)(*interpolate data for the convenience*)
CoolColor[z_] := RGBColor[z, 0.5, 1 - z];
Div[{intX[x, y], intY[x, y]}, {x, y}]; (*BB[*)(*find divergence*)
ContourPlot[%, {x, 1, 5}, {y, 1, 5}, ColorFunction -> CoolColor]
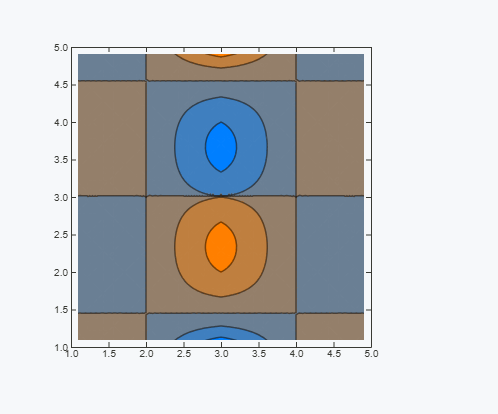
From a physical point of view, it means that there is a source node at the bottom and a drain at the top, which should not be a feature of a closed system with incompressible fluid.
Removing the Divergence
One can try to solve this problem iteratively by taking a field with non-zero divergency and apply artificial tranformation on it to make it satisfy the equation. There is a clever algorithm for removing the divergence of an arbitrary 2D vector field, which acts like a cellular automaton
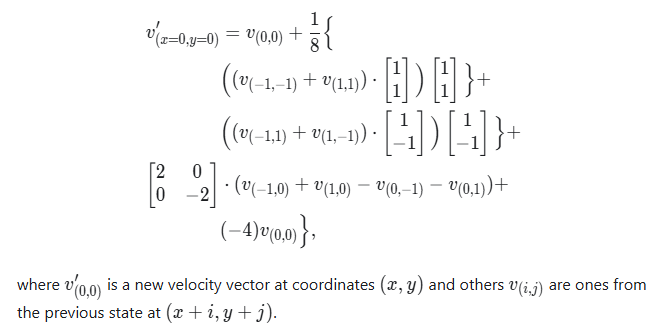
This is done by adding flow away from high pressure converging areas, and toward low pressure diverging areas.
Here is our implementation
removeDivergence[grid_] :=
 With[{(*safety checks,which enforce closed boundaries*)
   take = Function[{array, x, y},
     If[x >= 1 && x <= Length[grid] && y >= 1 && y <= Length[grid],
      array[[x, y]], {0, 0}]]},
  MapIndexed[
   Function[{val, i},
    val +(*FB[*)((1)(*,*)/(*,*)(8.0))(*]FB*)  (((take[grid,
              i[[1]] - 1, i[[2]] - 1] +
             take[grid, i[[1]] + 1, i[[2]] + 1]) . {1, 1}) {1,
          1} + ((take[grid, i[[1]] - 1, i[[2]] + 1] +
             take[grid, i[[1]] + 1,
              i[[2]] - 1]) . {1, -1}) {1, -1} + (take[grid,
            i[[1]] - 1, i[[2]]] + take[grid, i[[1]] + 1, i[[2]]] -
           take[grid, i[[1]], i[[2]] - 1] -
           take[grid, i[[1]], i[[2]] + 1]) {2, -2} +
        take[grid, i[[1]], i[[2]]]  (-4))], grid, {2}]]
Let us test it.
Table[Nest[removeDivergence, grid, i] // showAsMatrix, {i, 0,2}] // Row
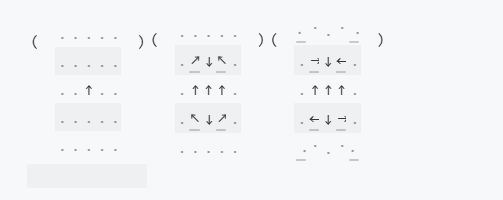
As you can see, if we have a stream of fluid from A to B, there must be some other streams made from B to A. The applied procedure produces the missing one spread over the whole grid if removeDivergence is applied multiple times.
We can check it directly by calculating the divergence.
plotDiv[grid_] :=
 Module[{intX, intY, x,
   y}, {intX, intY} = {ListInterpolation[grid[[All, All, 1]]],
    ListInterpolation[
     grid[[All, All, 2]]]};(*interpolate data for the convenience*)
  With[{div = Div[{intX[x, y], intY[x, y]}, {x, y}]},
   ContourPlot[div, {x, 1, 5}, {y, 1, 5},
    ColorFunctionScaling -> False,(*make sure to have the same scale*)
    ColorFunction -> ColorData[{"ThermometerColors", {-1, 1}}]]]]

{{Style["Original", 14], plotDiv[grid]}, {Style["8 iterations", 14],
    plotDiv[Nest[removeDivergence, grid, 8]]}} // Transpose // Grid
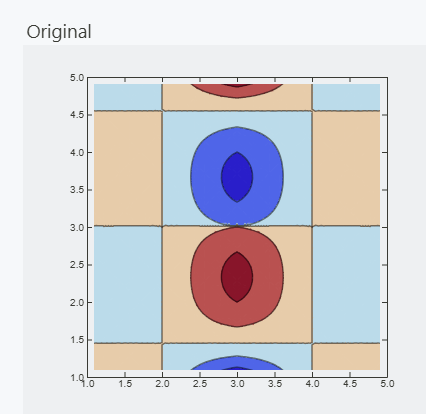
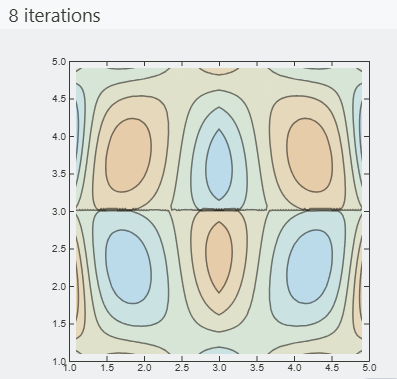
Apart from obvious artifacts caused by interpolation on a small grid, this algorithm definitely works. However, it is still far from modeling a fluid.
Interactive Example
We can try to solve this in real-time and see how it reacts live. However, the current approach to visualizing will be quite slow when it comes to dynamics.
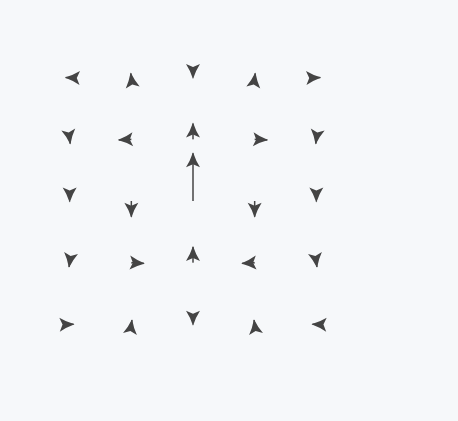
If we just try to reevaluate ListVectorPlot directly, it will be horribly slow. In general, there is no need to reevaluate the whole expression for graphics. The grid is the same, but vectors differ. We can go either fully raster using Image or use SVG graphics. The latter is the easiest way. Let us start from the ground up.
grid = grid // removeDivergence;

Graphics[{Table[
   Arrow[{{i, j}, {i, j} + 1.5 grid[[i]][[j]]}], {i, 5}, {j, 5}]},
 PlotRange -> {{0, 6}, {0, 6}}, ImagePadding -> None]
What about a color you ask. One can calculate Hue based on the polar angle of our vector
Graphics[{Table[{Hue[((\[Pi] + 2 ToPolarCoordinates[grid[[i]][[j]]] //
          Last)/(3  \[Pi]))],
    Arrow[{{i, j}, {i, j} + 1.5 grid[[i]][[j]]}]}, {i, 5}, {j, 5}]},
 PlotRange -> {{0, 6}, {0, 6}}, ImagePadding -> None]
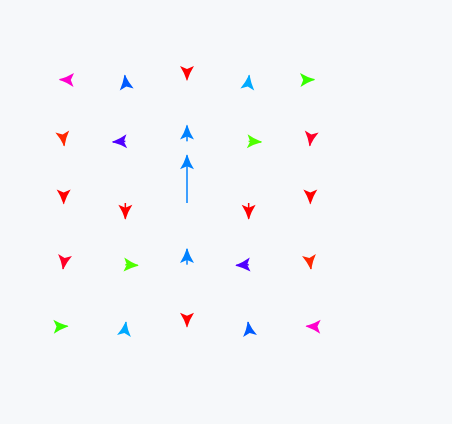
Now we basically recreated VectorPlot function in our primitive way. The next step will be to implement dynamic updates.
Dynamic Evaluation
The key feature to fast dynamic evaluation is to minimize the amount of data transferred between the Kernel and frontend as well as the number of things updated.
We need to couple the Arrow primitive to a specific element of our array grid. To do this, one can use the Offload wrapper, which acts similarly to Hold
grid = Table[{0., 0.}, {i, 5}, {j, 5}];
grid[[3, 3]] = {0, 1.0}; (*initial divergence*)

Graphics[{Table[
   With[{i = i, j = j},(*to substitute numbers,not symbols*)
    Arrow[{{i, j}, {i, j} + 1.5 grid[[i]][[j]]} // Offload]], {i,
    5}, {j, 5}]}, PlotRange -> {{0.5, 5.5}, {0.5, 5.5}},
 ImagePadding -> None]
Now try to evaluate the next cell multiple times.
grid = grid // removeDivergence;
Let us increase the resolution and automate the process using AnimationFrameListener. In general, one can also add dynamic color to our arrows as well.
TL;DR Here is our final code for this part
bgrid = Table[{0., 0.}, {i, 15}, {j, 15}];
   bcolors = Table[1.0, {Length[bgrid]}, {Length[bgrid]}];

   start = {1, 1};
   drawing = False;
   dest = {0, 0};
   bfps = 0;

   With[{win =
      CurrentWindow[],(*save the current window to append graphics*)
     currentCell = ResultCell[]},
    EventHandler[
     win, {"Closed" ->
       Function[Null,
        Delete[currentCell] (*remove output cell if a notebook has \
been closed*)(*this will prevent the animation running uncontrollably \
on the next start*)]}];
    Graphics[{Table[
       With[{i = i,
         j = j},(*now we have dynamic Hue and dynamic Arrow*)
        Offload[{Hue[bcolors[[i]][[j]]],
          Arrow[{{i, j}, {i, j} + bgrid[[i]][[j]]}]}]], {i, 15}, {j,
        15}],(*attach listeners to a user's mouse to manipulate the \
grid*)EventHandler[
       Graphics`Canvas[], {"mouseup" ->
         Function[xy,
          With[{v = -Normalize[start - xy]},
           Do[(*draw a line of velocities*)
             With[{p = Round /@ ((xy - start) a + start)},
               If[p[[1]] <= 15 && p[[1]] >= 1 && p[[2]] <= 15 &&
                  p[[2]] >= 1,
                 bgrid[[p[[1]], p[[2]]]] = {v[[1]], v[[2]]};];];, {a,
              0, 1, 0.1}];];
          Delete[drawing];(*delete temporal arrow*)drawing = False;],
        "mousemove" -> Function[xy, dest = xy;],
        "mousedown" -> Function[xy, start = xy;
          dest = xy;
          If[drawing =!= False, Delete[drawing]];
          (*append GUI's arrow to existing canvas*)
          drawing =
           FrontSubmit[{AbsoluteThickness[3], Gray,
             Arrow[{xy, dest // Offload}]}, MetaMarker["bcanvas"],
            "Window" -> win,
            "Tracking" ->
             True (*enable tracking of created object*)(*sync with \
browser's repaint cycle and update of fps label*) \
AnimationFrameListener[bfps // Offload,
               "Event" ->
                "bframe"],(*mark this instance of Graphics with uid \
to append new elements*)
            MetaMarker["bcanvas"], Text[bfps // Offload, {0, 0}]},
  Controls -> False, ImageSize -> 500,
  PlotRange -> {{-0.5, 15.5}, {-0.5, 15.5}}, ImagePadding -> None,
  TransitionType -> None]]

(*subscribe to animation event*)

btime = AbsoluteTime[];

EventHandler["bframe",
  Function[Null, bgrid = removeDivergence[bgrid] // N;
   bcolors =
    Map[Function[
      val, ((\[Pi] + 2.0 ToPolarCoordinates[val] //
          Last)/(3.0  \[Pi]))], bgrid, {2}];
   bfps = (((bfps + 1/(AbsoluteTime[] - btime)))/(2.0)) // Round;
   btime = AbsoluteTime[];]];
The code can be divided into two parts: visualization using Graphics and Arrow and calculation loop.
As we discussed before, we draw each point from a grid individually with a pair of Hue and Arrow. At the same place, we attach listeners to the Graphics canvas to capture mouse clicks and movements to modify the velocity field.
Animation is done using AnimationFrameListener coupled to fpsLabel, which works as a trigger to a new frame. It serves two goals:
- Sync animation with the browser's repaint cycle.
- Do not start a new frame until the data is ready, which is indicated by fpsLabel. It can also be grid, but since fpsLabel is the last symbol to be updated before a new frame, we have chosen it to be a trigger. Then, before a new frame, it fires an event object with "bframe" uid, which is captured later by EventHandler. In the animation loop, it removes divergence, recalculates colors, and then also updates the FPS counter just for the statistics.
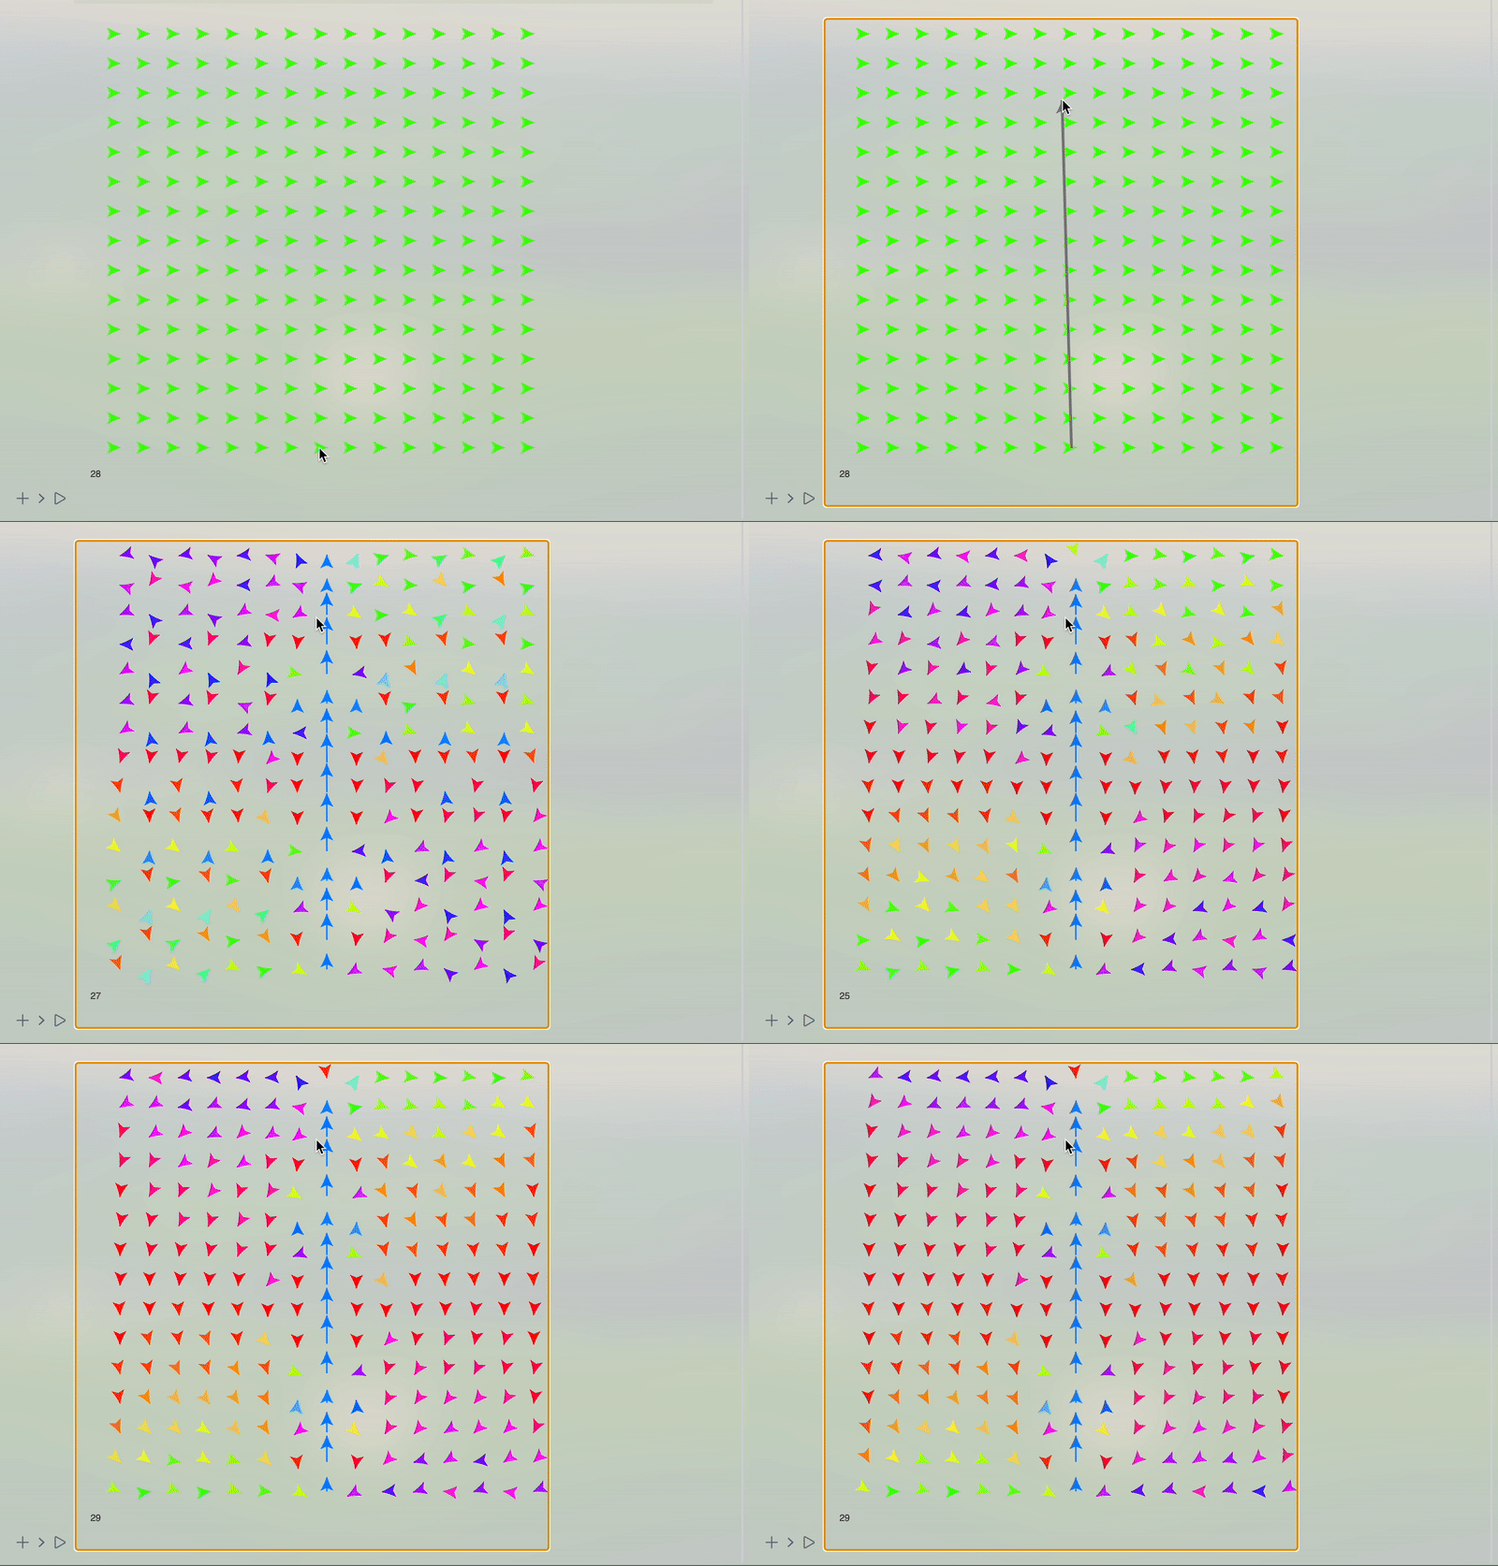
An expected result is shown below 
It is quite far from an actual fluid. We should also consider its momentum.