The World Health Organization is tracking the recent outbreak of the Ebola virus in four African countries: Guinea, Liberia, Nigeria, and Sierra Leone. In this post I look at mapping this data to help visualize it. We start out with defining the countries:
CountryNames = {"Guinea", "Liberia", "Nigeria", "Sierra Leone"}
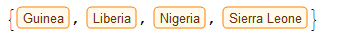
We can map the function SemanticInterpretation over these names to get the entity objects for these countries:
Countries = SemanticInterpretation /@ CountryNames
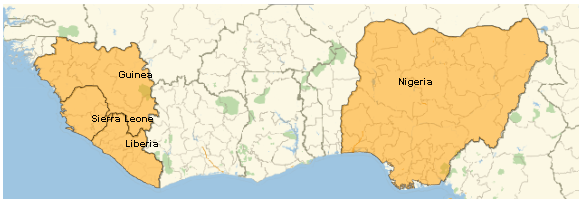
With these entities we can highlight the affected countries using GeoListPlot:
GeoListPlot[Countries, ImageSize -> Large, GeoLabels -> True]
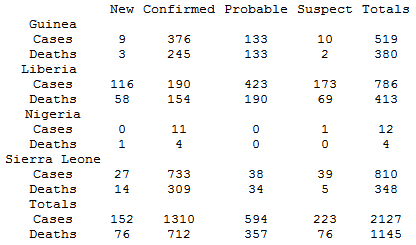
The World Health organization publishes data on the spread of this disease. The following code imports the table part of this publication:
xml = Import["http://www.who.int/csr/don/2014_08_15_ebola/en/", "XMLObject"];
table = Cases[xml, XMLElement["table", ___], \[Infinity]];
data = Flatten[Cases[table, XMLElement["td", _, d_] :> d, \[Infinity]] /. {{} -> "", "New (1)\n" -> "New"}];
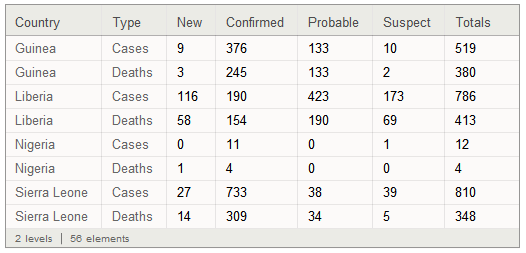
Grid[data = Partition[data, 6]]
For simpler data access we can transform this expression into a Dataset, which allow database-like access to its contents. This code loops once through data and organizes it:
dataset = Dataset[Take[DeleteCases[
 Map[
 Which[
   First[#] === "",
   keys = Rest[#];,
   And[First[#] =!= "Deaths", First[#] =!= "Cases"],
   country = First[#];,
   Or[First[#] === "Deaths", First[#] === "Cases"],
   <|"Country" -> StringTrim[country], "Type" -> First[#],
    Sequence @@
     MapThread[Rule, {keys, ToExpression /@ Rest[#]}]|>] &,
 data], Null], {1, -3}]]
We can now access data from this dataset, for example the total cases for Guinea (returns 519):
dataset[SelectFirst[#Country == "Guinea" && #Type == "Cases" &], "Totals"]
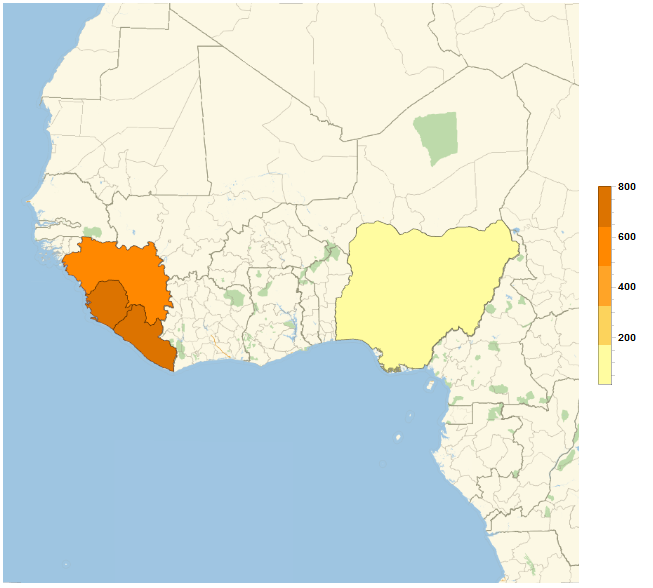
Or we can map the totals for all countries using GeoRegionValuePlot:
GeoRegionValuePlot[
  Map[Rule[CountryData[#],
    With[{c = #}, dataset[SelectFirst[#Country == c && #Type == "Cases" &],
  "Totals"]]] &, CountryNames],
 GeoRange -> Quantity[2000, "Kilometers"], ImageSize -> Large]


