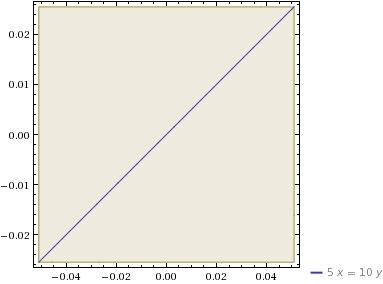
I entered simple inequality and equality functions into wolfram alpha but it does not plot the function and display the region which satisfies the inequalities at the same time. Here's a quick example: plot 6x+5y < 100; y>10 ; x>5 ; 5x=10y. This is what wolfram alpha would display: 
All I'm looking for is a way to display the region of the inequalities and the equality. Please keep in mind that I am no expert with wolfram alpha. The help would be greatly appreciated. Thank you!