Message Boards Message Boards

Issue with contour plot

Look at these two images(attached and notebook images). When r is greater than some value G becomes negative in G-r plot, but when I try to use contour plot the color corresponding to negative values of G does not appear in the contour plot. How can I fix this? Please find the notebook.G-r.
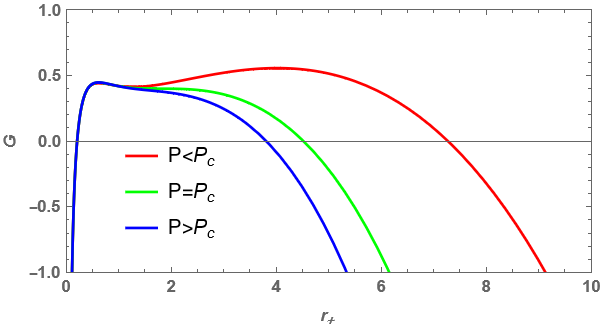
.

POSTED BY: Debojyoti Mondal

Maybe the contours overlap and only the top one is visible. Try plotting the various contours separately to check this.

POSTED BY: Gianluca Gorni
Reply to this discussion
Community posts can be styled and formatted using the Markdown syntax.
Reply Preview
Attachments
Remove
or Discard

Group Abstract Group Abstract