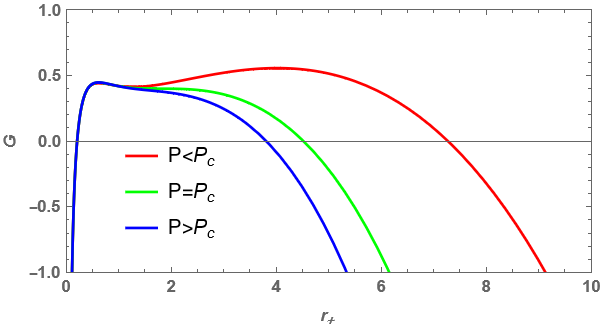
Look at these two images(attached and notebook images). When r is greater than some value G becomes negative in G-r plot, but when I try to use contour plot the color corresponding to negative values of G does not appear in the contour plot. How can I fix this? Please find the notebook. .
.
.