Yes, this is a bit weird. Now that I'm back at a computer I can test it a bit. First I will note that the experiment suggested by Henrik does in fact give the expected frequency. But that strikes me as weird because if one "periodizes" that data by repeating it then there's a jump where the end of one set and the beginning of the next are both zero.
First I tried Fourier. To refine the estimate I use 10 times as many data points.
n = 1000;
data = Cos[2 \[Pi] Range[0, n - 1]*0.25] // N;
ft = Fourier[data];
Position[Abs@ft, Max[Abs[ft]]]

(* Out[134]= {{251}, {751}} *)
This suggests 25 is correct, noting that the first element is the DC component and 251-1 is 250.
Now back to periodograms. I have no familiarity with Periodogram. I will claim a passing familiarity with the Wolfram Resource Function IrregularPeriodogram (having written it a few years back). So I will go back to the original data and show what we have.
n = 100;
data = Cos[2 \[Pi] Range[0, n - 1]*0.25] // N;
I'll show the periodogram to the extent that we are sure to recover the frequency (pretending we already know the right ballpark). Note that I am subtracting off the mean value. This is unneccessary in this case because it is zero (or rather, numerical fuzz). But I'll need it for the next case.
Plot[ResourceFunction["IrregularPeriodogram"][t, Range[Length[data]],
  data - Mean[data]], {t, 0, 5}, PlotRange -> All, PlotPoints -> 50]
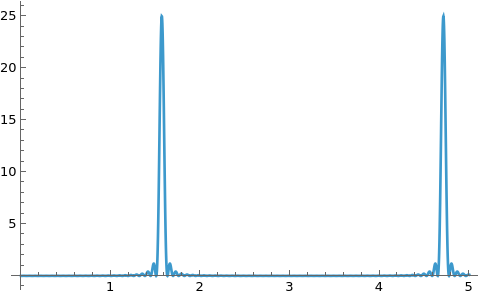
Now find the max frequency, that is, locate a peak value.
NMaximize[ ResourceFunction["IrregularPeriodogram"][t, Range[Length[data]],
  data - Mean[data]], {t, 1.4, 1.8}]

(* Out[161]= {25., {t -> 1.5708}} *)
Very clearly this is 25. Now I'll redo this, but taking data to n instead of n-1. The periodogram plot is similar to the one above so I will omit it and just get that frequency estimate.
datan = Cos[2 \[Pi] Range[0, n]*0.25] // N;
NMaximize[
 ResourceFunction["IrregularPeriodogram"][t, Range[Length[datan]],
  datan - Mean[datan]], {t, 1.4, 1.8}]

(* Out[183]= {25.7425, {t -> 1.57079}} *)
This is further evidence that what you did in the original post was correct; if we go to n-1 we get the expected frequency and going to n we do not.
What to make of this? I don't know. You might want to send a bug report to our Tech Support. I'll also point someone more familiar with our signal processing to this question.


